Green Card Buildout
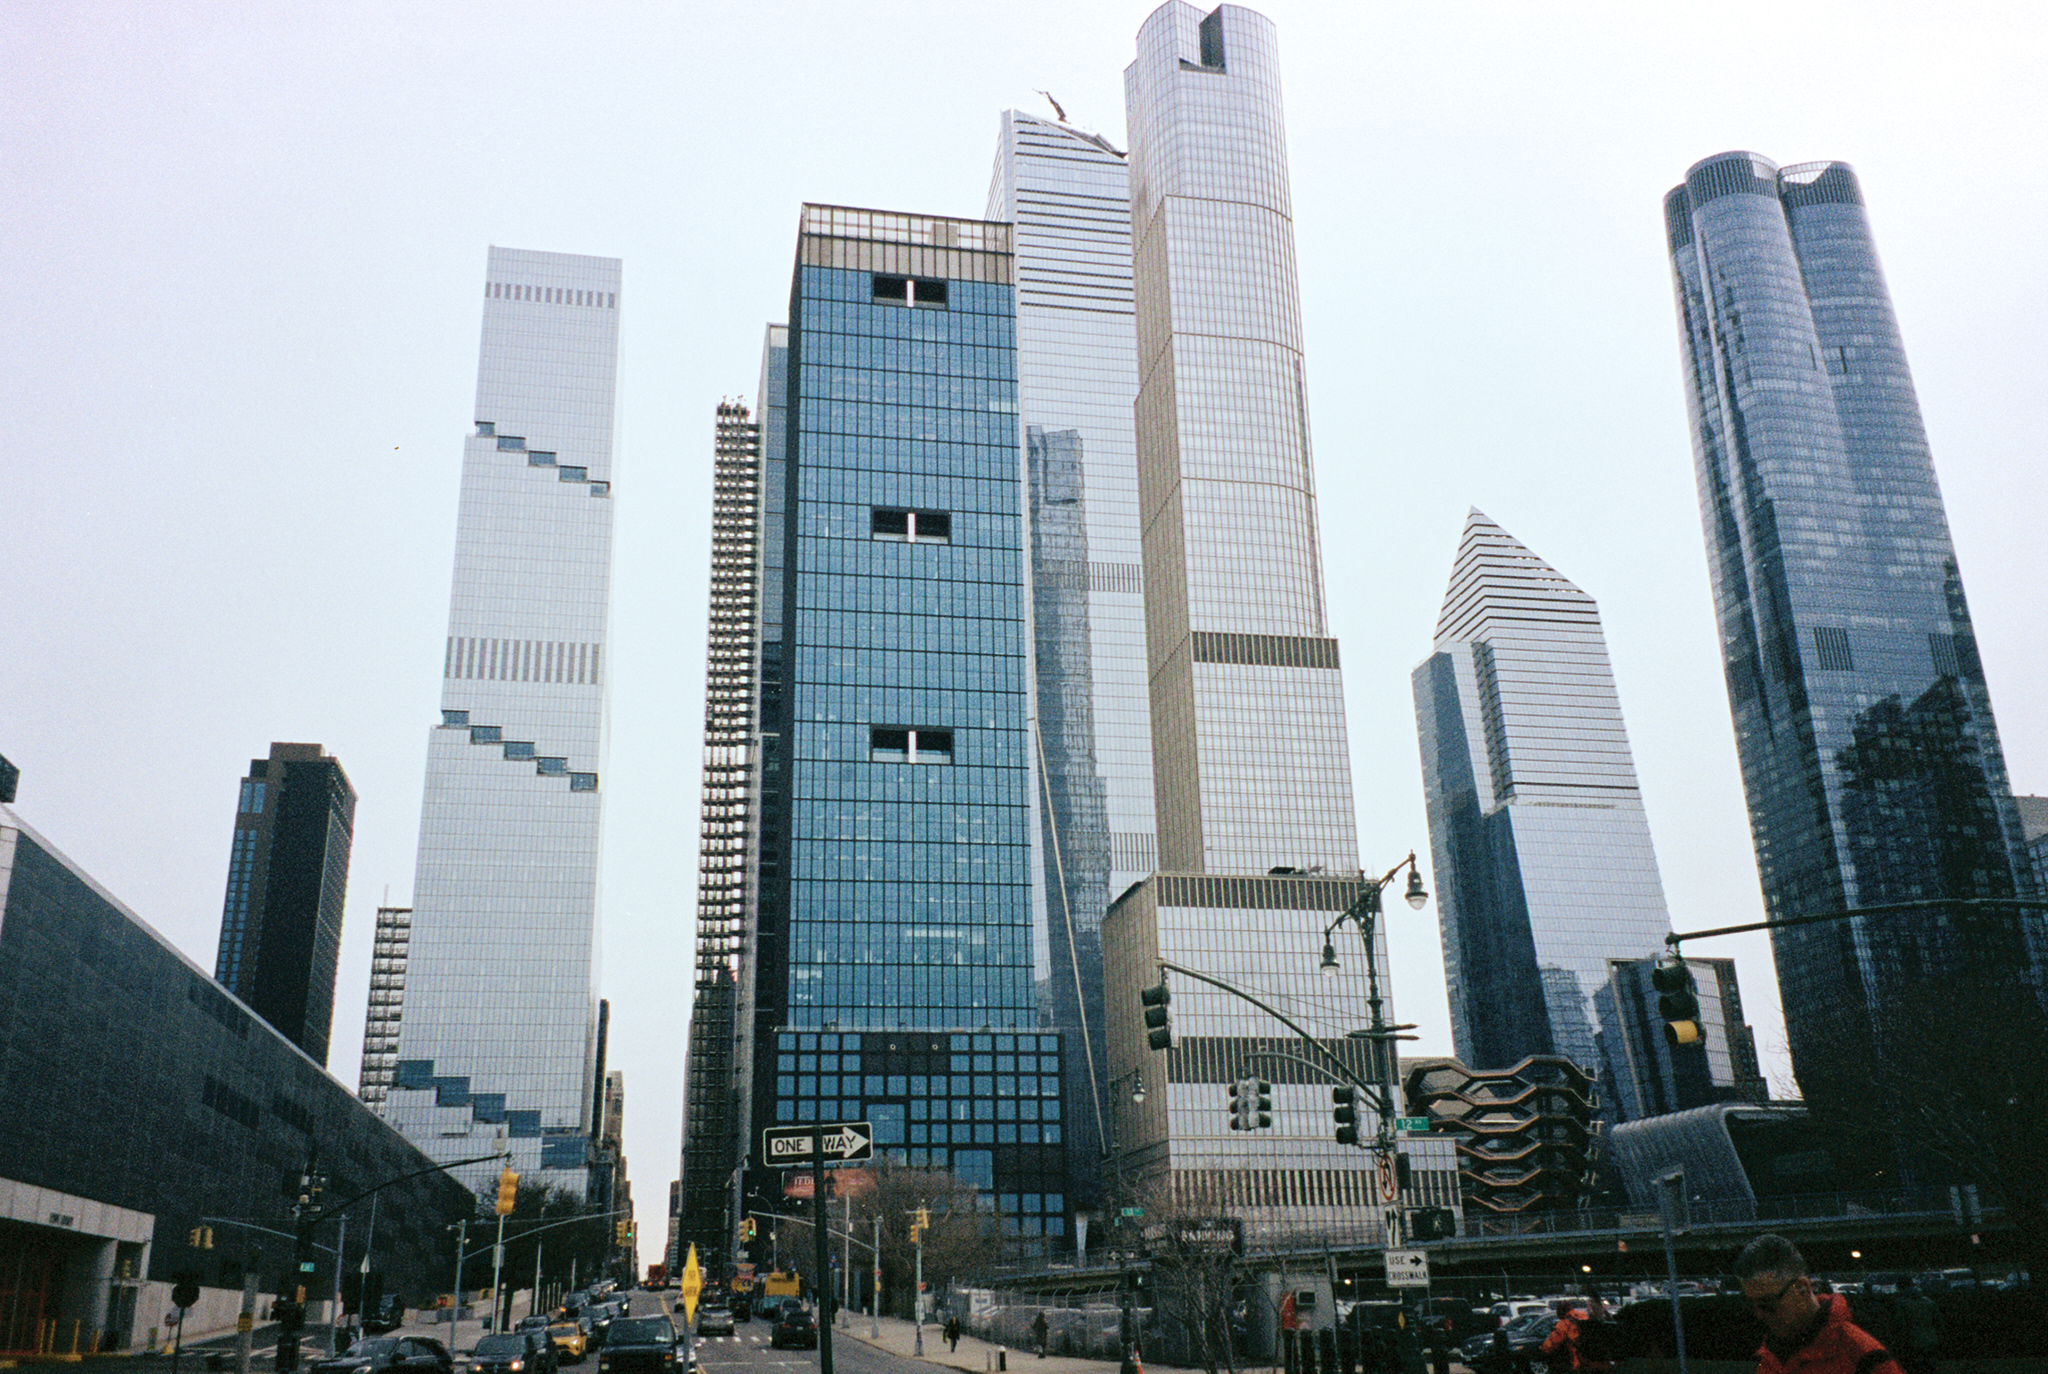
The image shows The Spiral (second-left) and 30 Hudson Yards (second-right), both funded by EB-5 capital.
Introduction: An Idealistic Intention, Unexpected Results
The news headline "Citizenship for Sale" has put the EB-5 Immigration Investor Program in the spotlight.[1] The connotation of the caption is not only unjustified for the program’s outlook but puts new immigrants in a reproached position. In the statement on signing the Immigration Act of 1990, President George H. W. Bush wrote, "S. 358 will promote the initiation of new business in rural areas and the investment of foreign capital in our economy."[2] His message was simple and clear about the new Immigration Investor Program: fund underdeveloped areas with foreign investment.
There was little evidence for the formulation of the program. The political climate in the transitioning Reagan-Bush era may provide reasons that incubated the infused immigrant investment policy.
First, the micro-recession in 1990. To balance the increasing domestic budget deficit and inflation that started by the end of the Reagan Administration, H. W. Bush raised taxes and tightened the Federal Reserve monetary policies.[3] This caused the United States to enter a temporary recession in early 1990, resulting in job losses in construction and a dip in the commercial real estate market.[4] How to create jobs and capital with minimum trade-offs was the priority agenda. Second, the diminishing role of Federal aid from the Reagan Administration in rural development.[5] The introduction of Enterprise Zones that granted local government flexibility and encouraged private sectors to redevelop distressed areas at their discretion,[6] the act may be viewed as a key reference to the EB-5 Immigrant Investor Program. Although it was never fully signed into law, the idea of turning a certain area into a market-friendly zone by providing incentives became a formula to support development.
Congress introduced the EB-5 Immigrant Investor Program as a part of the Immigration Act of 1990.[7] The program intended to encourage foreign entrepreneurship to create jobs in rural and high-unemployment areas by incentivizing investors' permanent residency.[8] Following underperformed results, Congress quickly amended the program in 1992 and created the Pilot Immigration Program (now renamed as Regional Center Program), which granted private companies access to collect funds from multiple foreign investors, serving as a supplementary addition to the original program.[9] Not until after the 2008 subprime mortgage crisis was the program rediscovered by troubled developers who faced difficulty borrowing loans from traditional financial institutions.[10] The supplementary Regional Center Program has become the main method in EB-5 Program for both developers and foreign investors for its convenience.[11]
An estimated 15.8 billion dollars (at least) has poured into targeted areas since, with most Asian investors.[12] The program has facilitated high-profile developments like Hudson Yards, Atlantic Yards, Brooklyn Navy Yards, and many five-star hotels and luxury condos in Manhattan. Not so surprisingly, due to the lack of Federal intervention and unrestricted zoning regulations, the outcome was derailed from the intended goal, which was supposed to benefit the distressed areas. In 2019, EB-5 Immigrant Investor Program Modernization was signed to limit the local government’s intervention in zoning regulations.[13] As a signal of the program’s overall economic success and to improve its performance, in 2022, President Joe Biden signed the revised EB-5 Integrity and Reform Act of 2022.[14] It is time to review the 30-year-old program through a satellite, urbanism lens. What has the program contributed to America’s development?
Project Scope
The project covers a wide range of scales to examine the EB-5 Immigration Investor Program, from national policy to local real estate development.
On a small scale, the project provides summaries regarding the program's policies, national interests, and overall economic outcomes. By looking at Congress's documentation and Department of State data, I have created diagrams to demonstrate the political engine. There are three topics, including EB-5 Immigrant Investor Chronicle, EB-5 Regional Center Development, and EB-5 Visa Application Process.
At the mid-scale, which serves as a further explanation of the small scale, the project displays the implementation under the national policy that reaches the state and private sector levels. By looking at the USCIS Regional Center list, various scholarly research, and regional center websites, this section covers three topics: Regional Center Registration by State, EB-5 Capital Structure, and EB-5 Regional Center Model.
On a large scale, the project serves as an atlas, a directory of the local geographic footprint of EB-5 Regional Center development. Due to the opaque EB-5 project data and the laborious work required to compile data at the detailed, state level, I will only showcase EB-5 projects in New York and Florida. This section describes the geographic characteristics and network of EB-5 projects. To illustrate the relationship for both New York and Florida, three interconnected graphs were created: EB-5 Regional Center Affiliation Network, Map of EB-5 Project, and Satellite Image of EB-5 Project Sorted by Capital.
Finally, besides the available data and information, the project includes selected photographs of EB-5 developments from the street view. For the last step of this urban study, the photographs capture the most direct representation of the outcome. They encapsulate both the immeasurable milieu and prescribable phenomena that emanated after the implementation of the policy.
Part 1: Policy, National Interest, and Economic Outcome
To begin with, the following topics present the program’s aims and general outcome.
1. EB-5 Immigrant Investor Program Chronicle
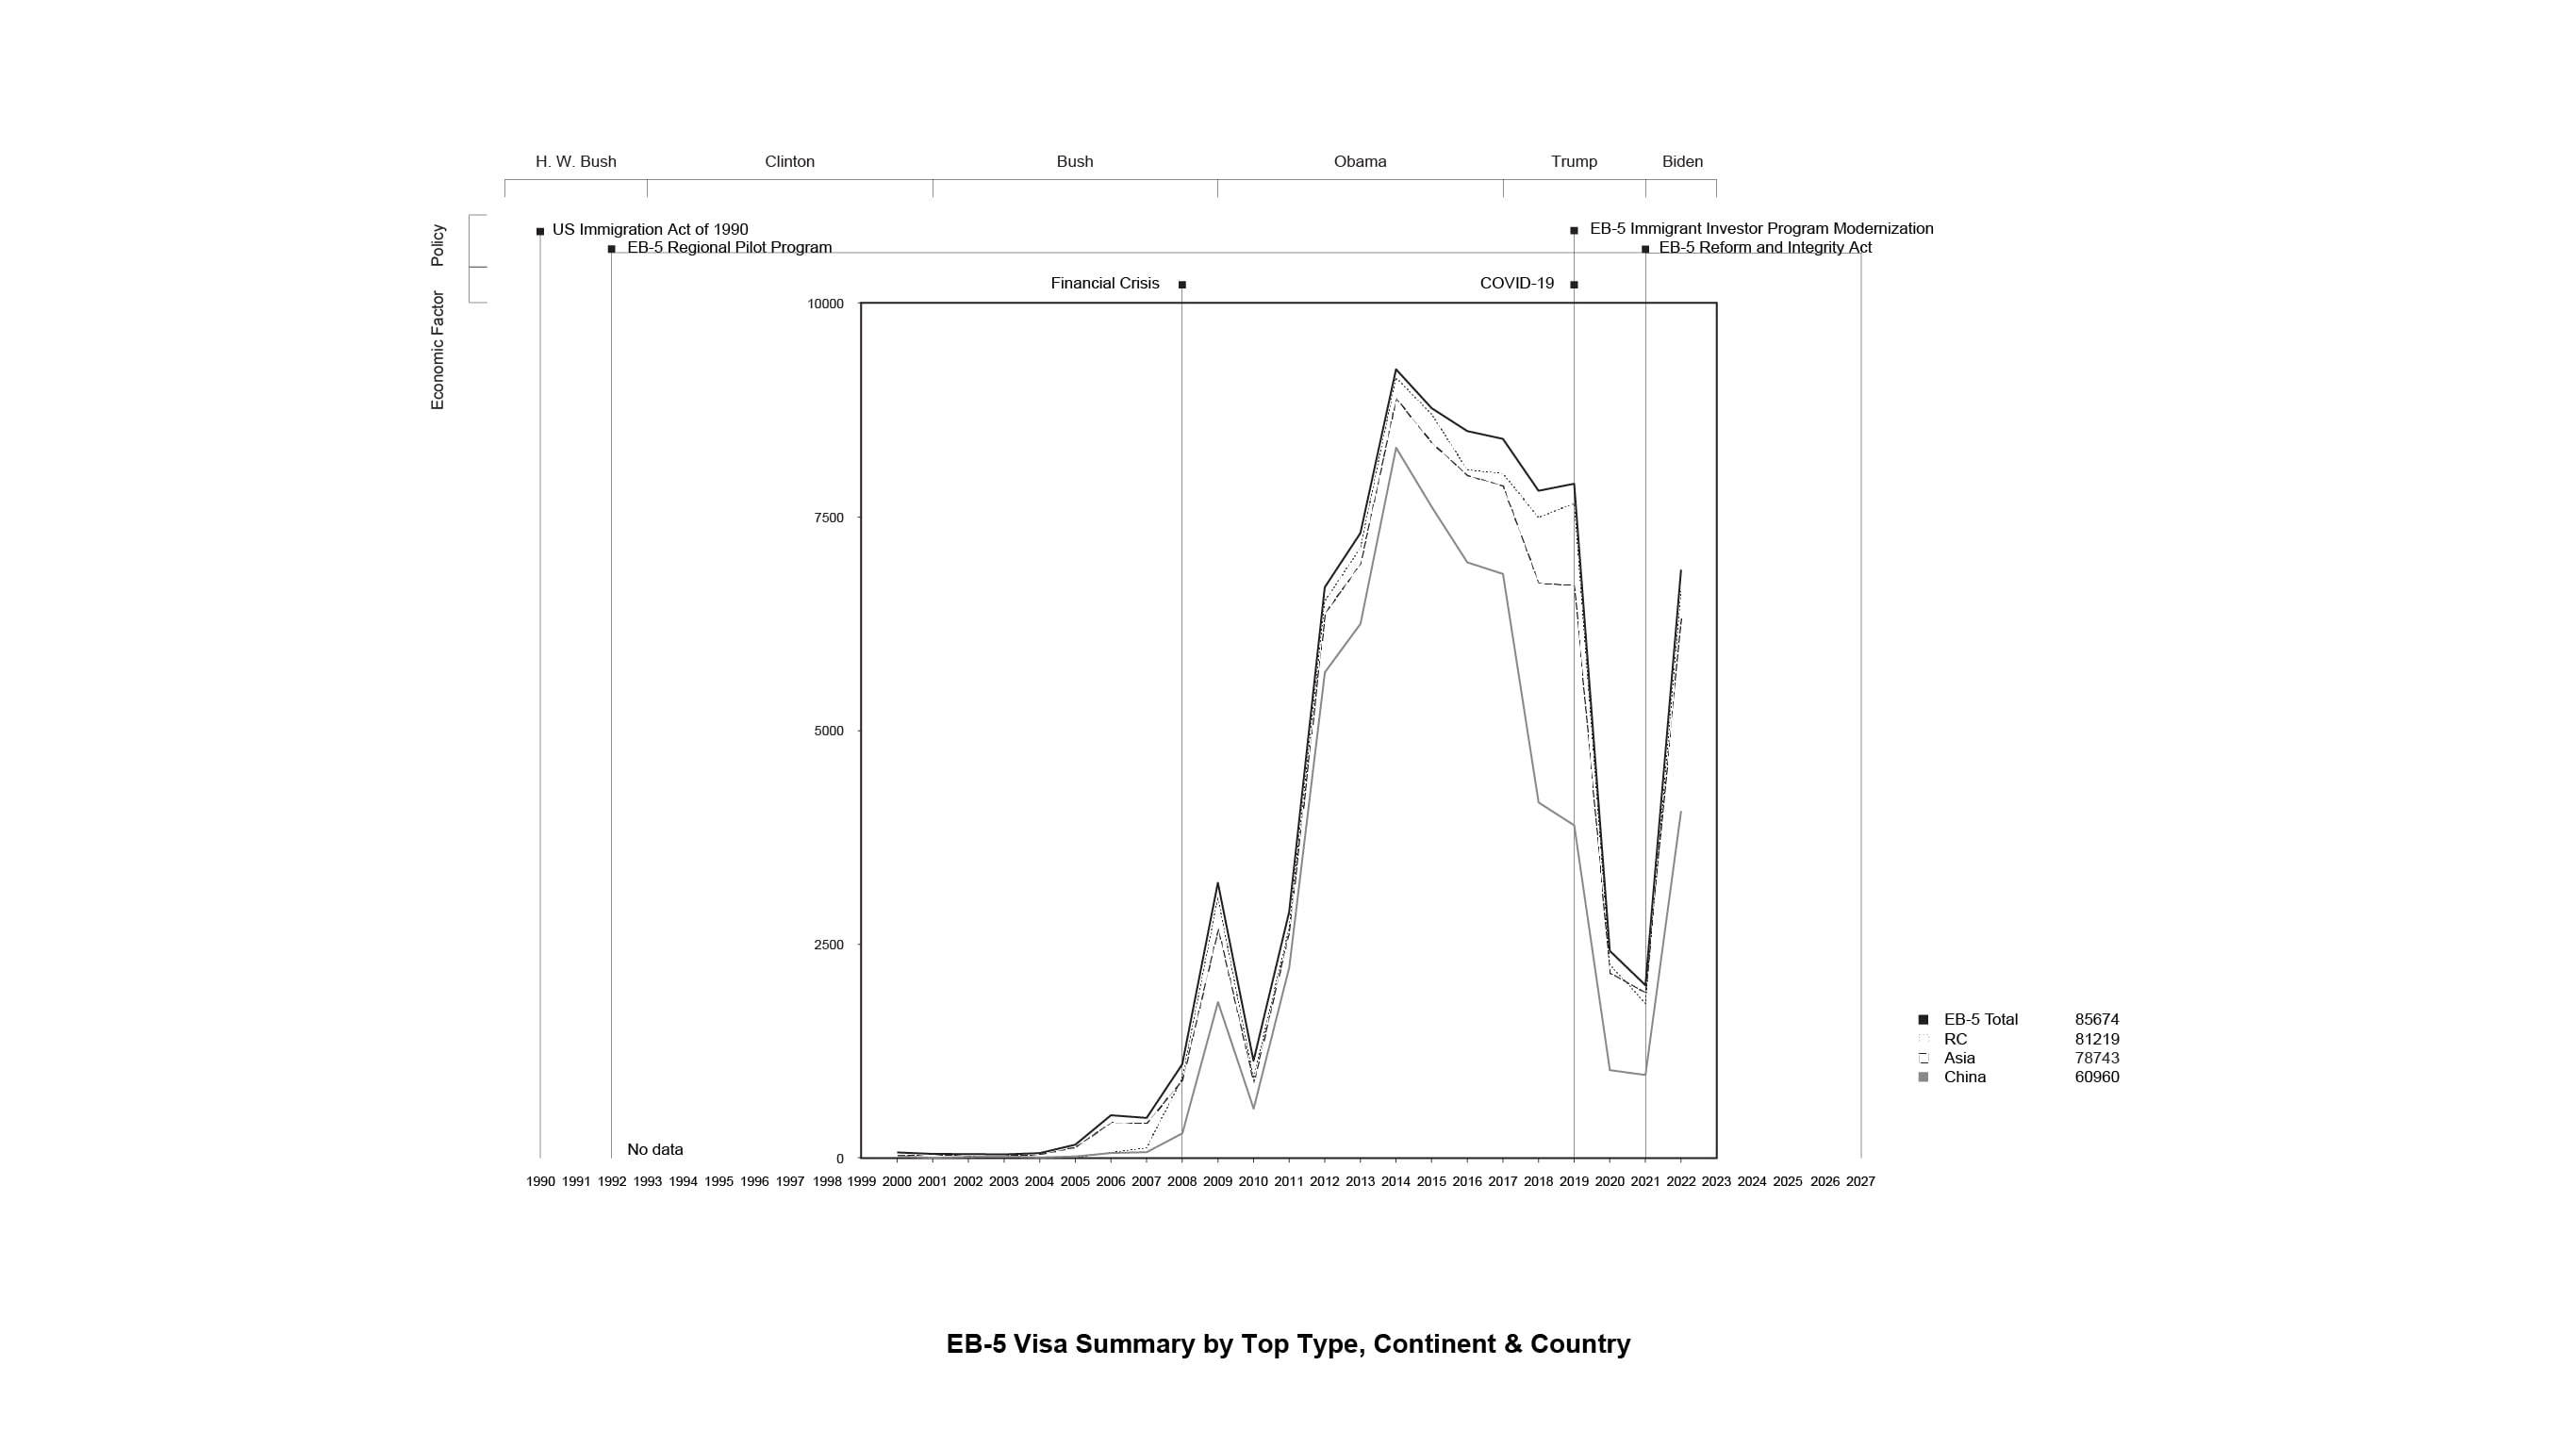
The chart depicts the trend in conditional EB-5 visa issuance from 2000 to 2022. Prior to the financial crisis, the program remained underutilized for almost two decades. According to a GAO study presented to the Congress Committee in 2005, the program's poor performance during the early stage resulted from the prolonged residency status of many applicants for as long as 10 years due to pending regulations and the uncertainty of job requirements.[15] The program gained popularity following the financial crisis, with the regional center serving as the primary method of the EB-5 program.
The most frequently employed approach is through regional centers, which account for about 95% of visa issuances. The majority of investors hail from Asia, particularly mainland China.
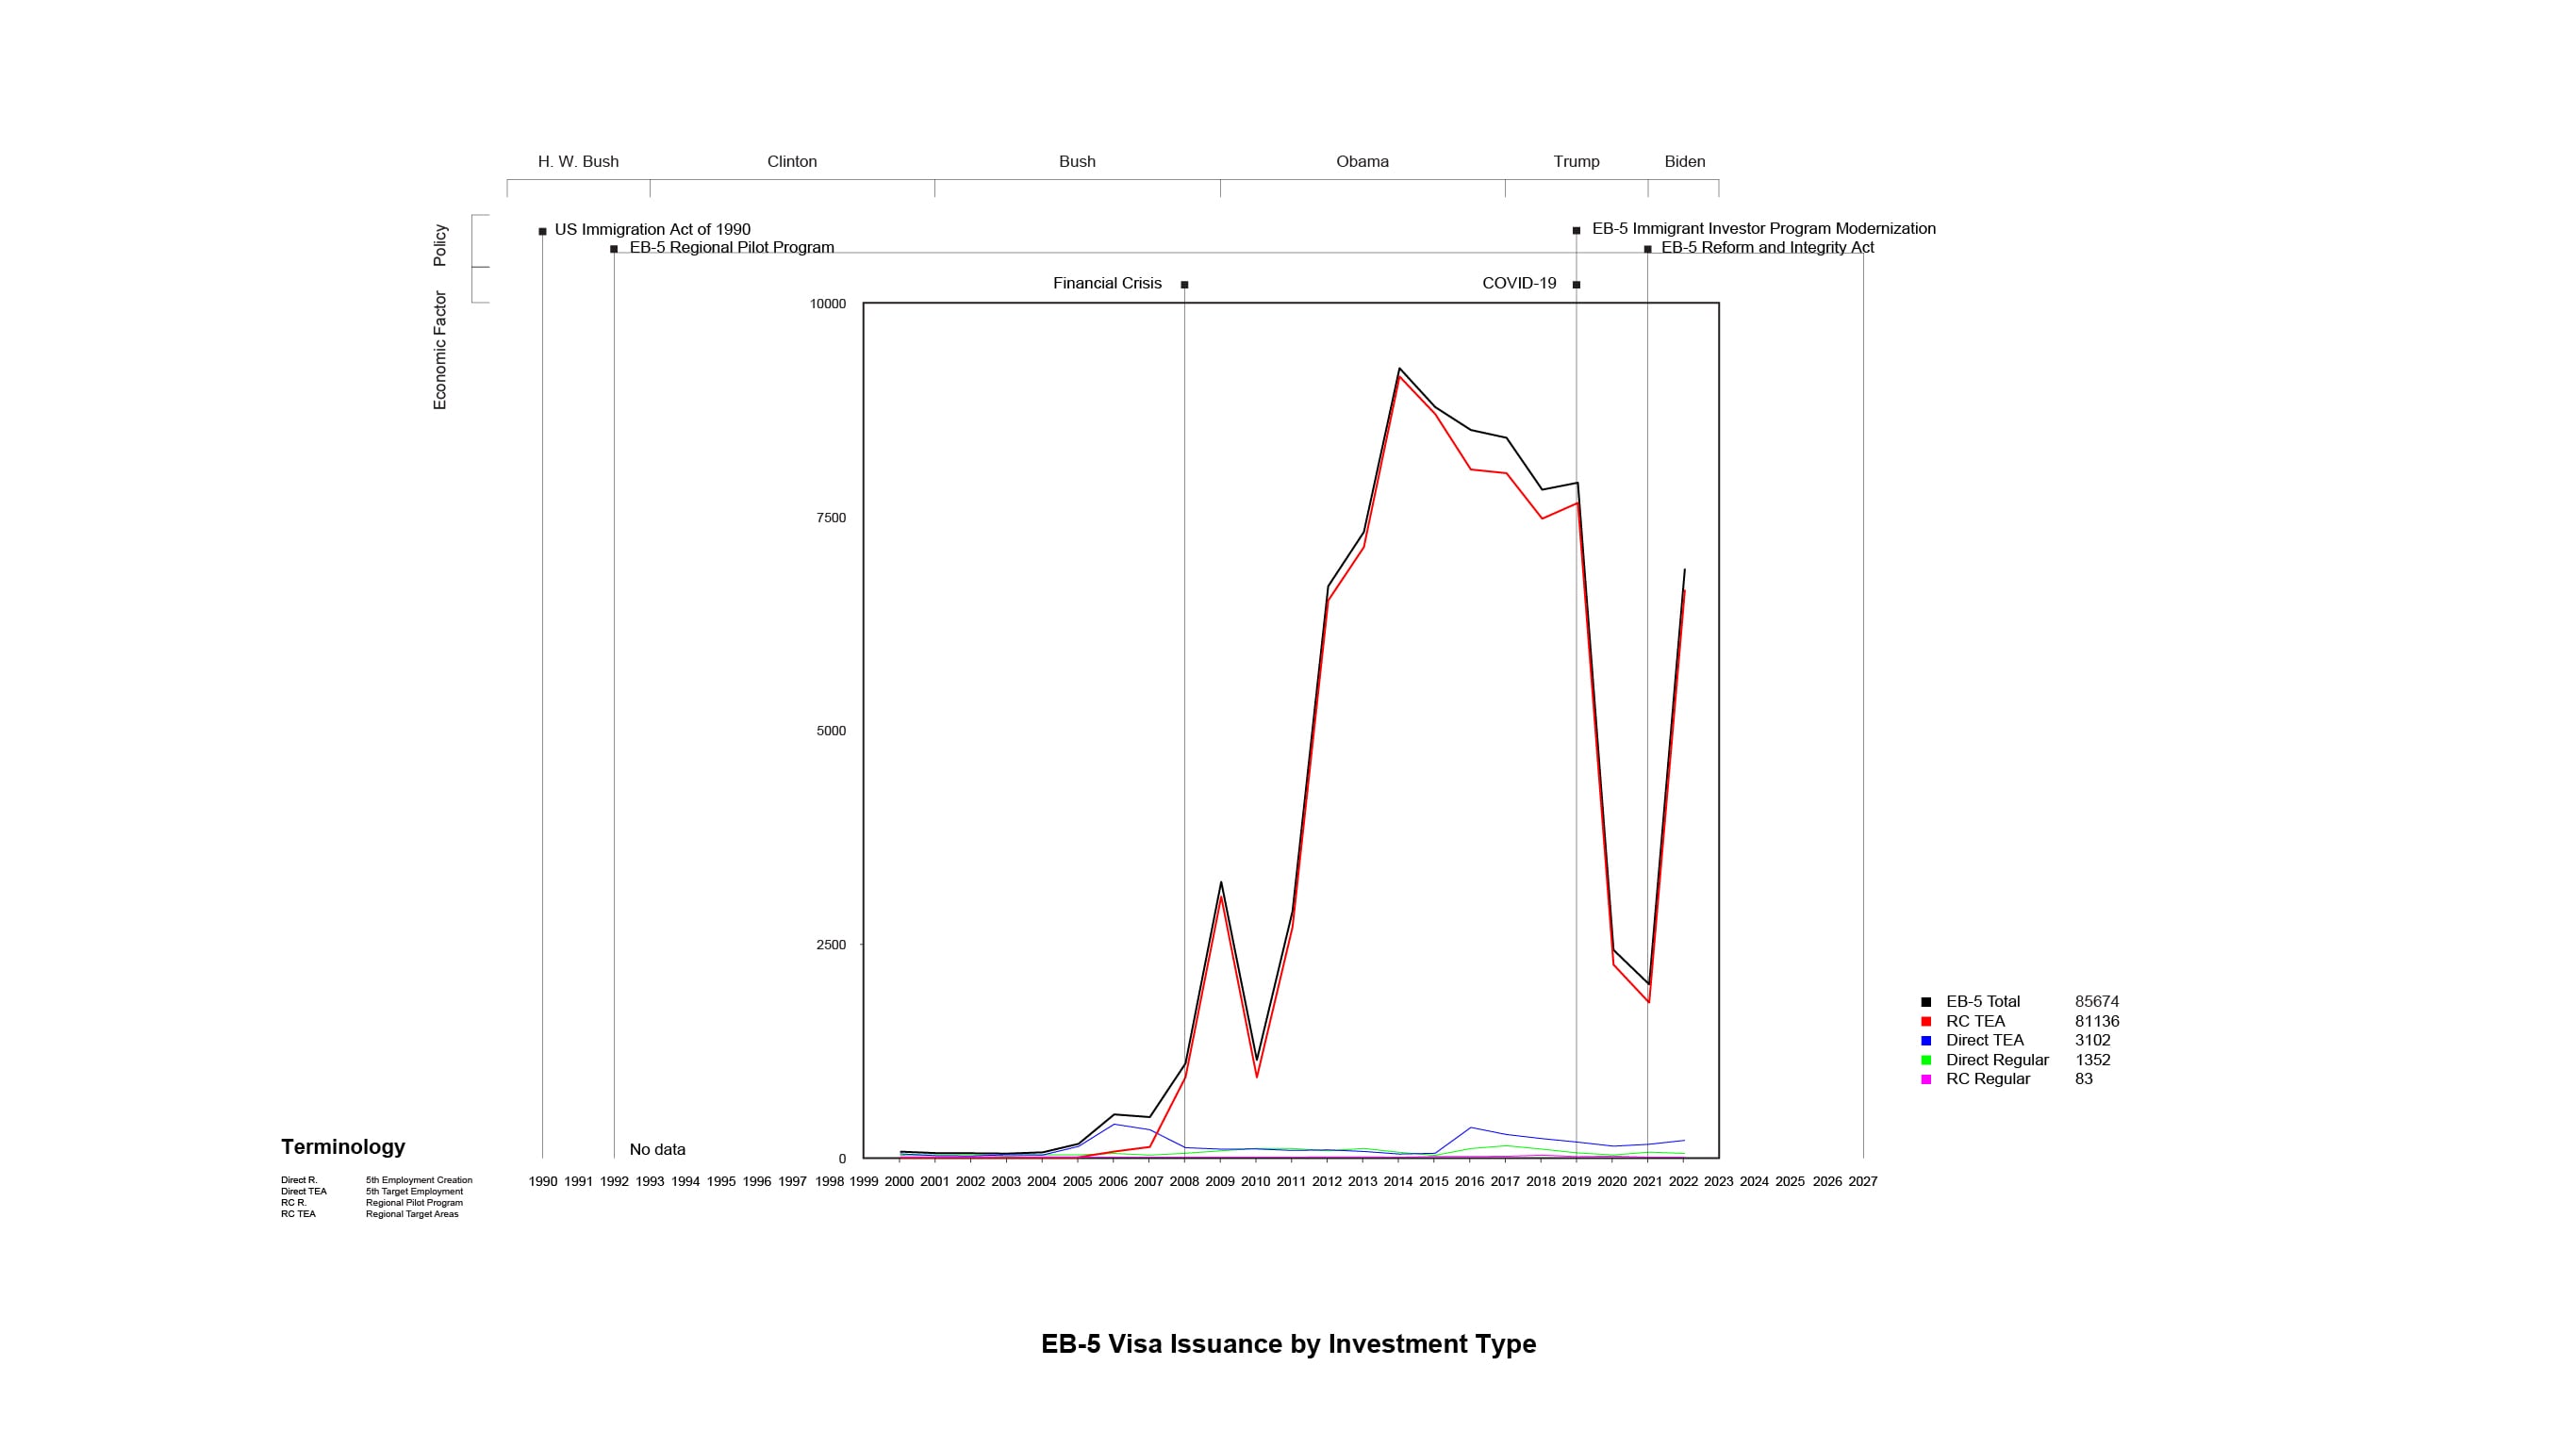
The chart shows the investment types available under the EB-5 program, which are EB-5 Direct Investment, EB-5 Direct Investment in a Targeted Employment Area, EB-5 Regional Pilot Program, and EB-5 Regional Pilot in a Targeted Employment Area. The EB-5 Regional Pilot in a Targeted Employment Area is the most popular option due to the involvement of regional centers and the reduced investment amount.
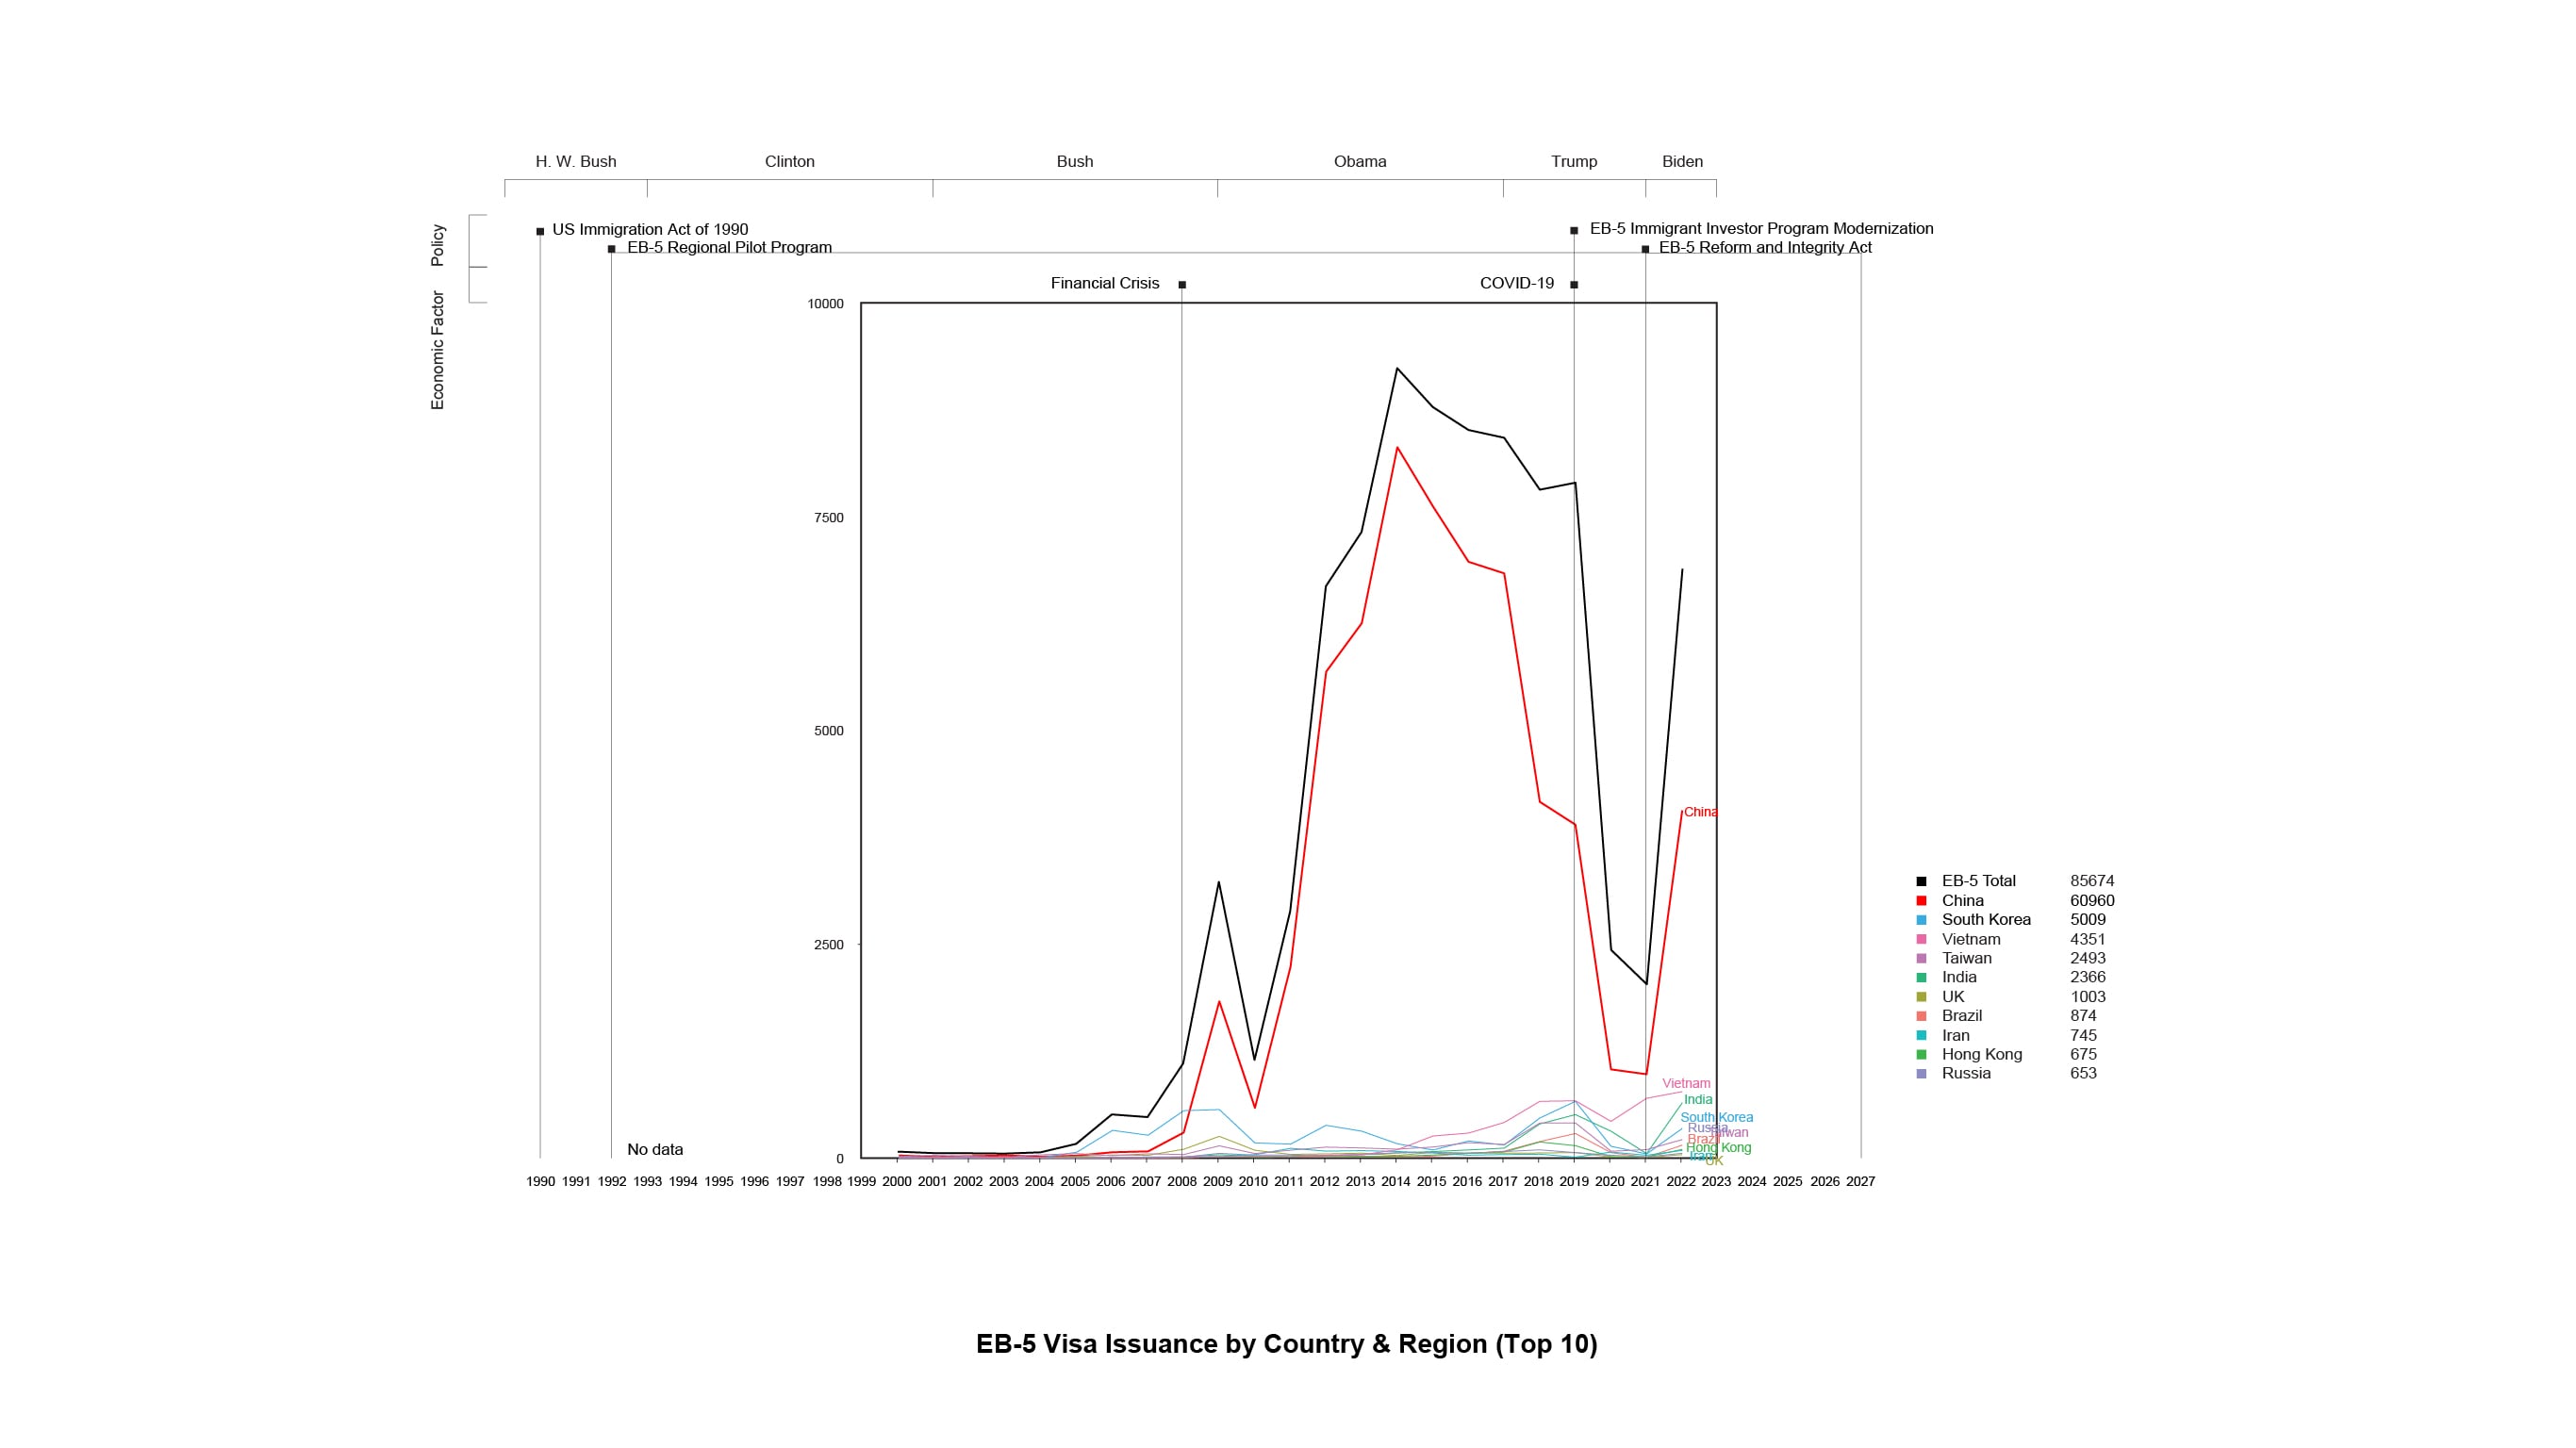
The top 10 countries of origin for the EB-5 program are China, South Korea, Vietnam, Taiwan, India, UK, Brazil, Iran, Hong Kong, and Russia. The number of visa issuances for Chinese investors has gone down considerably, although they still constitute the main group in the program. In recent years, investors from Vietnam and India have become more prominent.
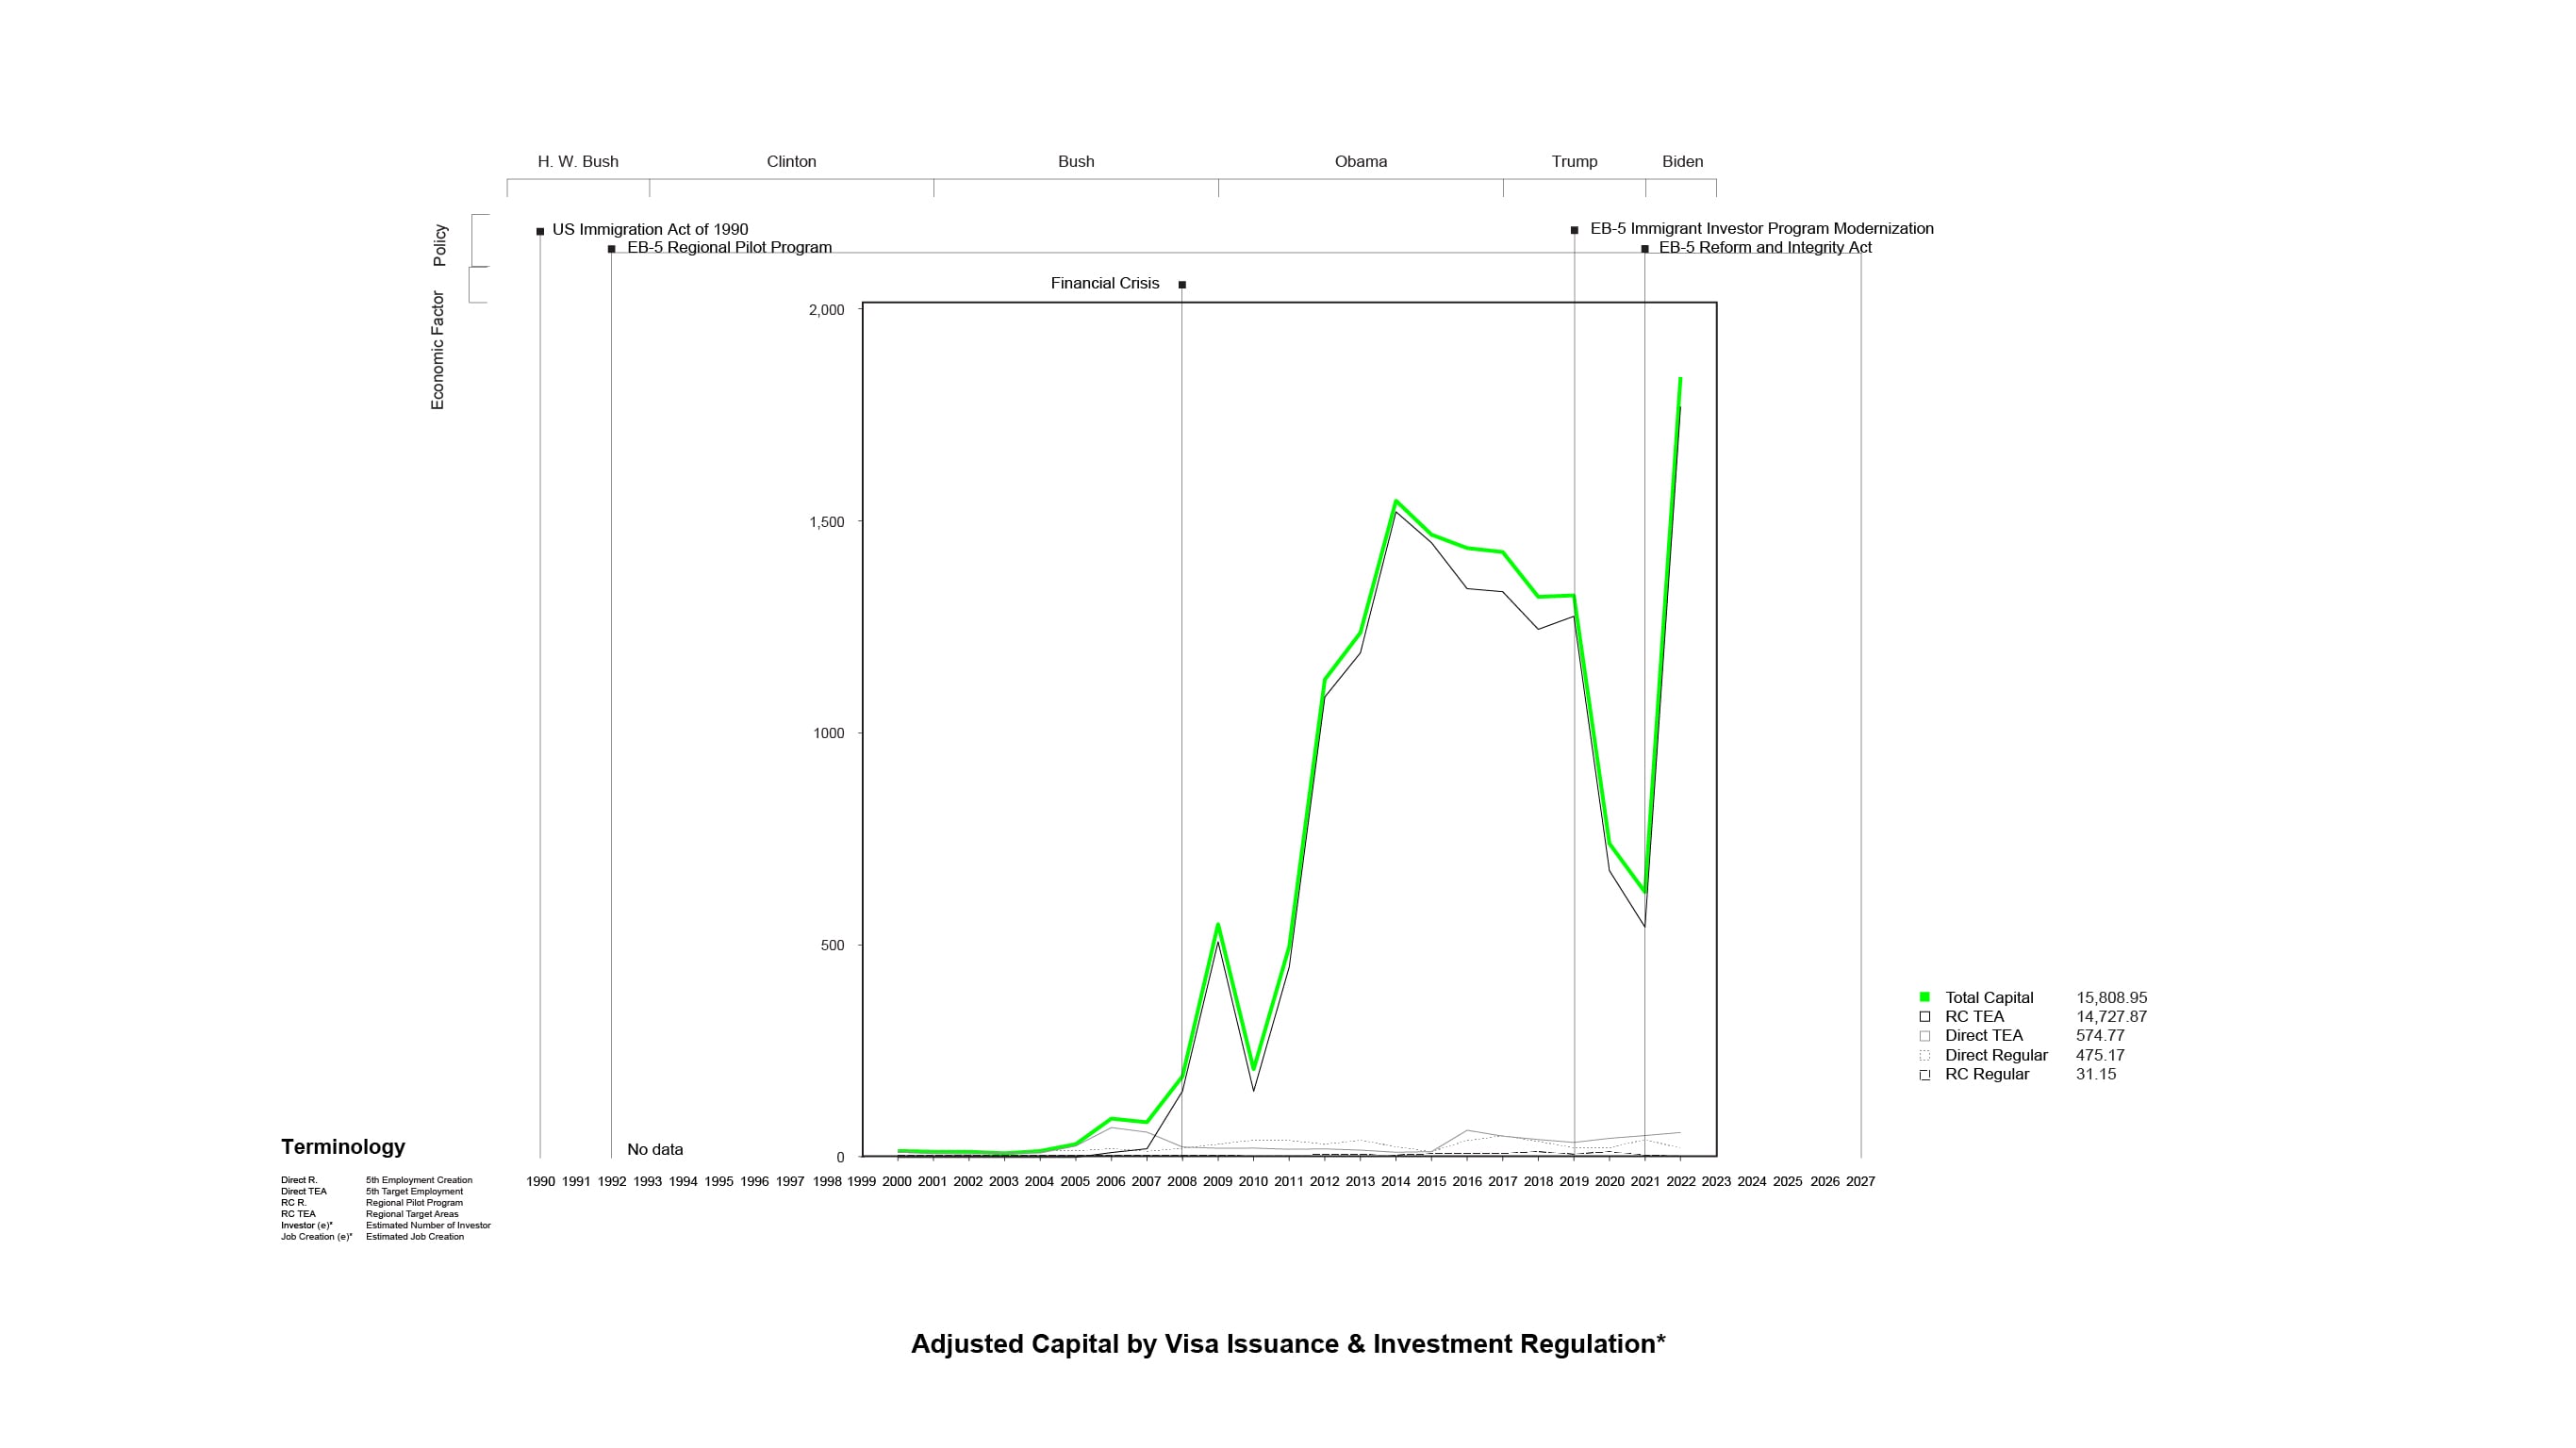
The estimated EB-5 capital from 2000 to 2022 is 15.8 billion dollars, and an estimated 468,351 direct and indirect jobs have been created. Please refer to the methodology section for detailed calculations.
2. EB-5 Regional Center Development
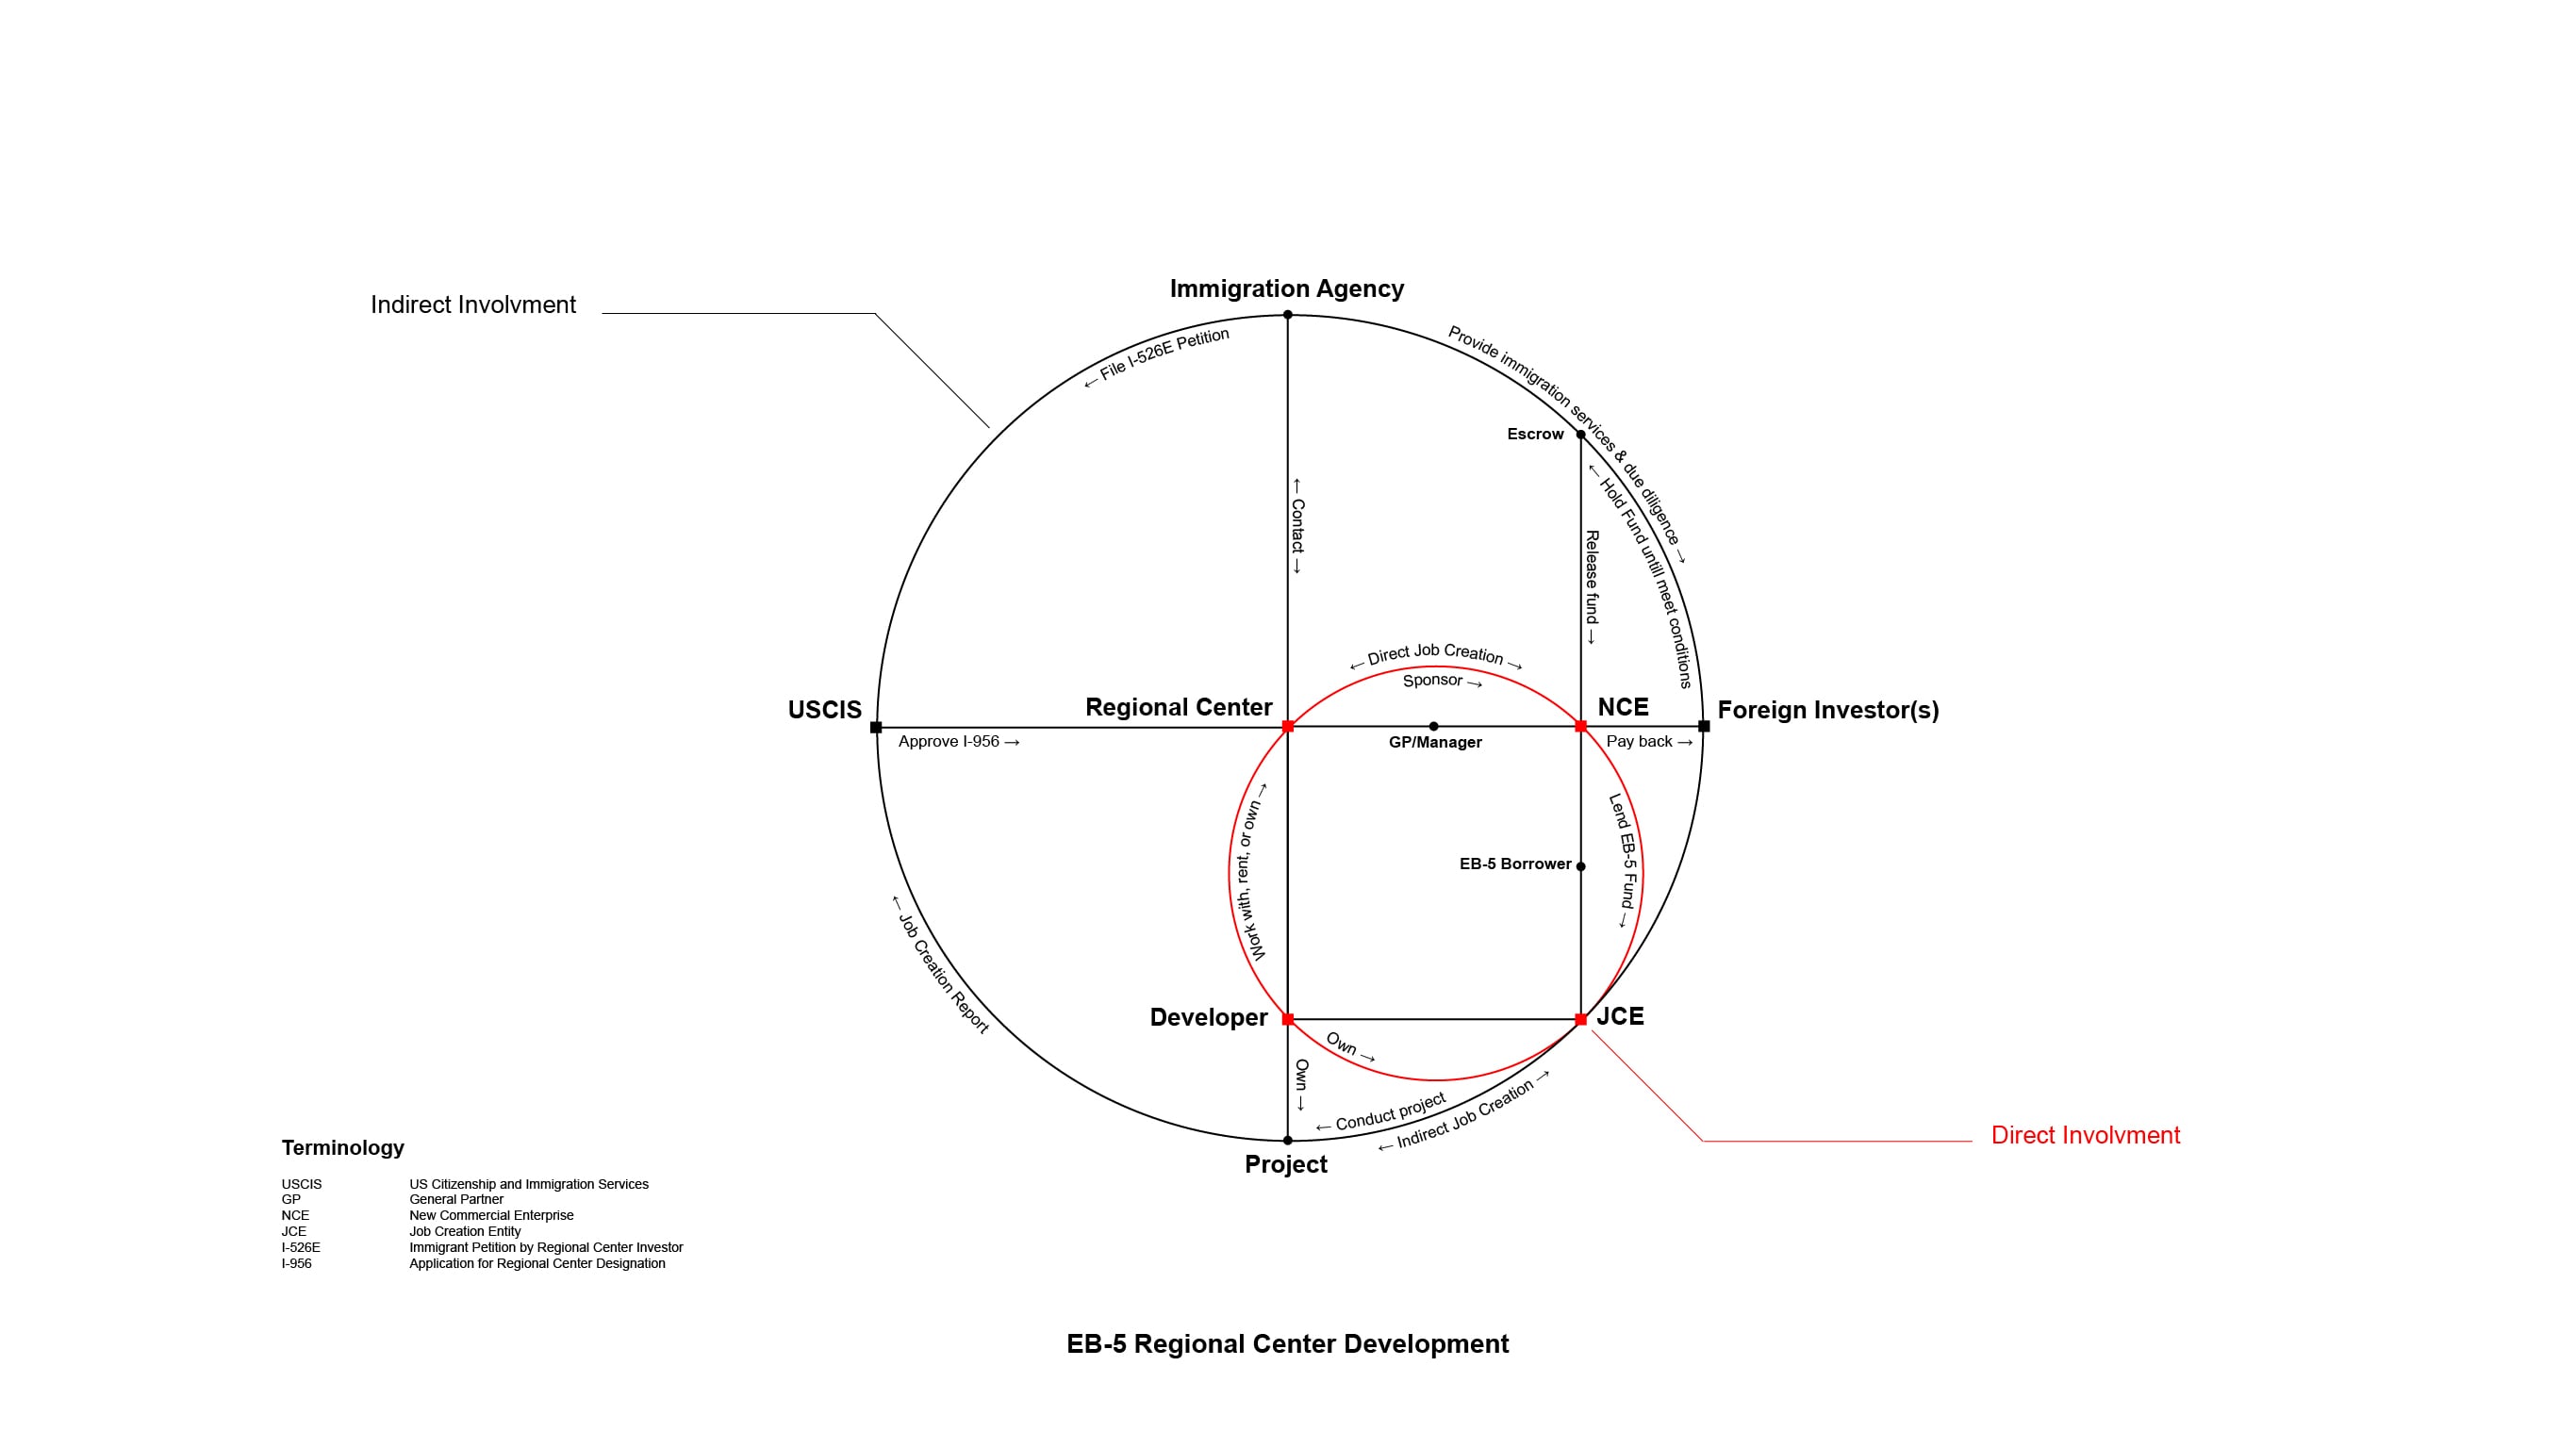
The diagram shows the simplified process of regional center development. A regional center is a private entity approved by the USCIS to create a New Commercial Enterprise (NCE) that collects foreign capital for a developer. The NCE usually arranges funds from multiple investors, who become equity holders of the NCE. A regional center can be a third-party company that works with many developers or can serve as a developer's affiliate that works under the developer to fund their projects. The Job Creation Entity (JCE) is a development company that receives funds from the NCE, developer, and financial institutions to conduct a project and hire workers. The regional center, NCE, developer, and JCE are directly involved in the development from financial and construction aspects. Foreign investors, however, do not have direct involvement and have little impact on the development.
3. EB-5 Visa Application Process
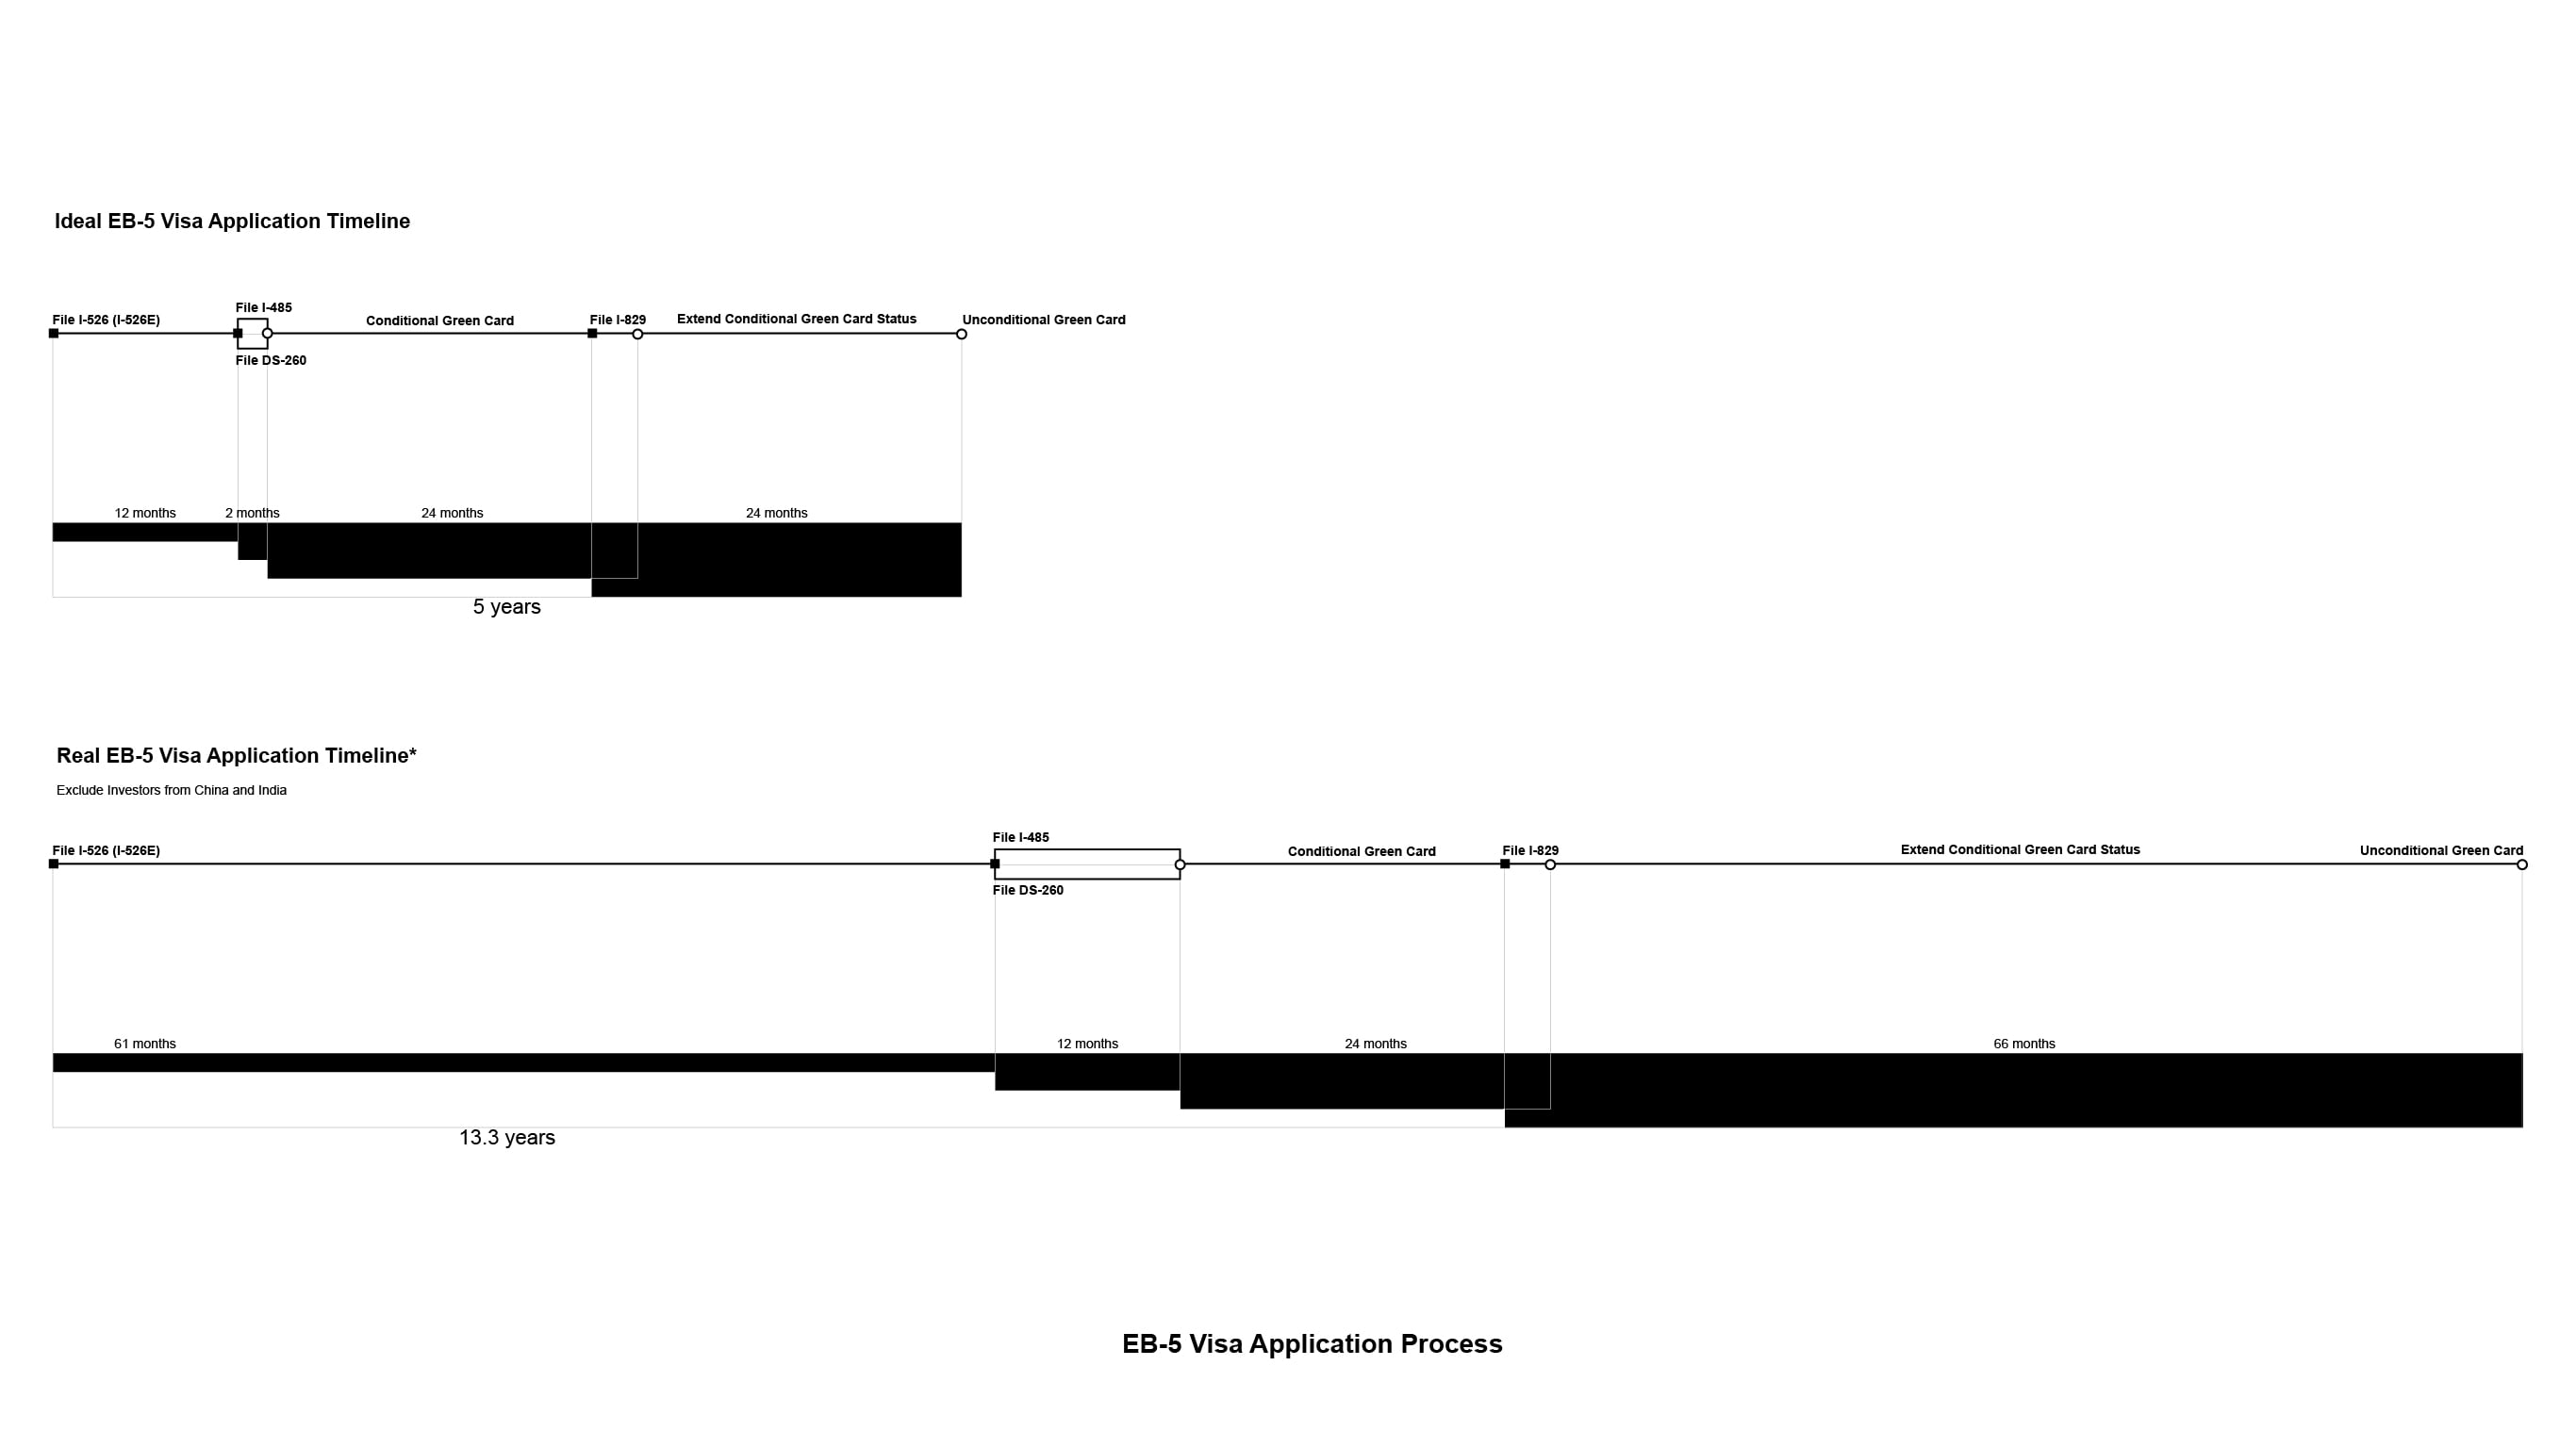
The diagram shows the timeline of EB-5 visa issuance. After the required number of jobs has been created by the initial investment in the construction, the investor (or the lawyer) can file the I-526 petition to obtain the conditional permanent resident status (conditional green card). 90 days before the conditional green card's expiration, the investor can file an I-829 petition to remove the conditional status and become an unconditional permanent resident.
The ideal timeline for each investor and their immediate family members to obtain unconditional permanent residency was originally set to 5 years by Congress and USCIS. However, due to the large number of EB-5 visa applications, the timeline has become extremely backlogged.
Part 2: The Implementation of the Policy
This part will demonstrate the private sector’s interpretations.
1. EB-5 Regional Center Registration by State
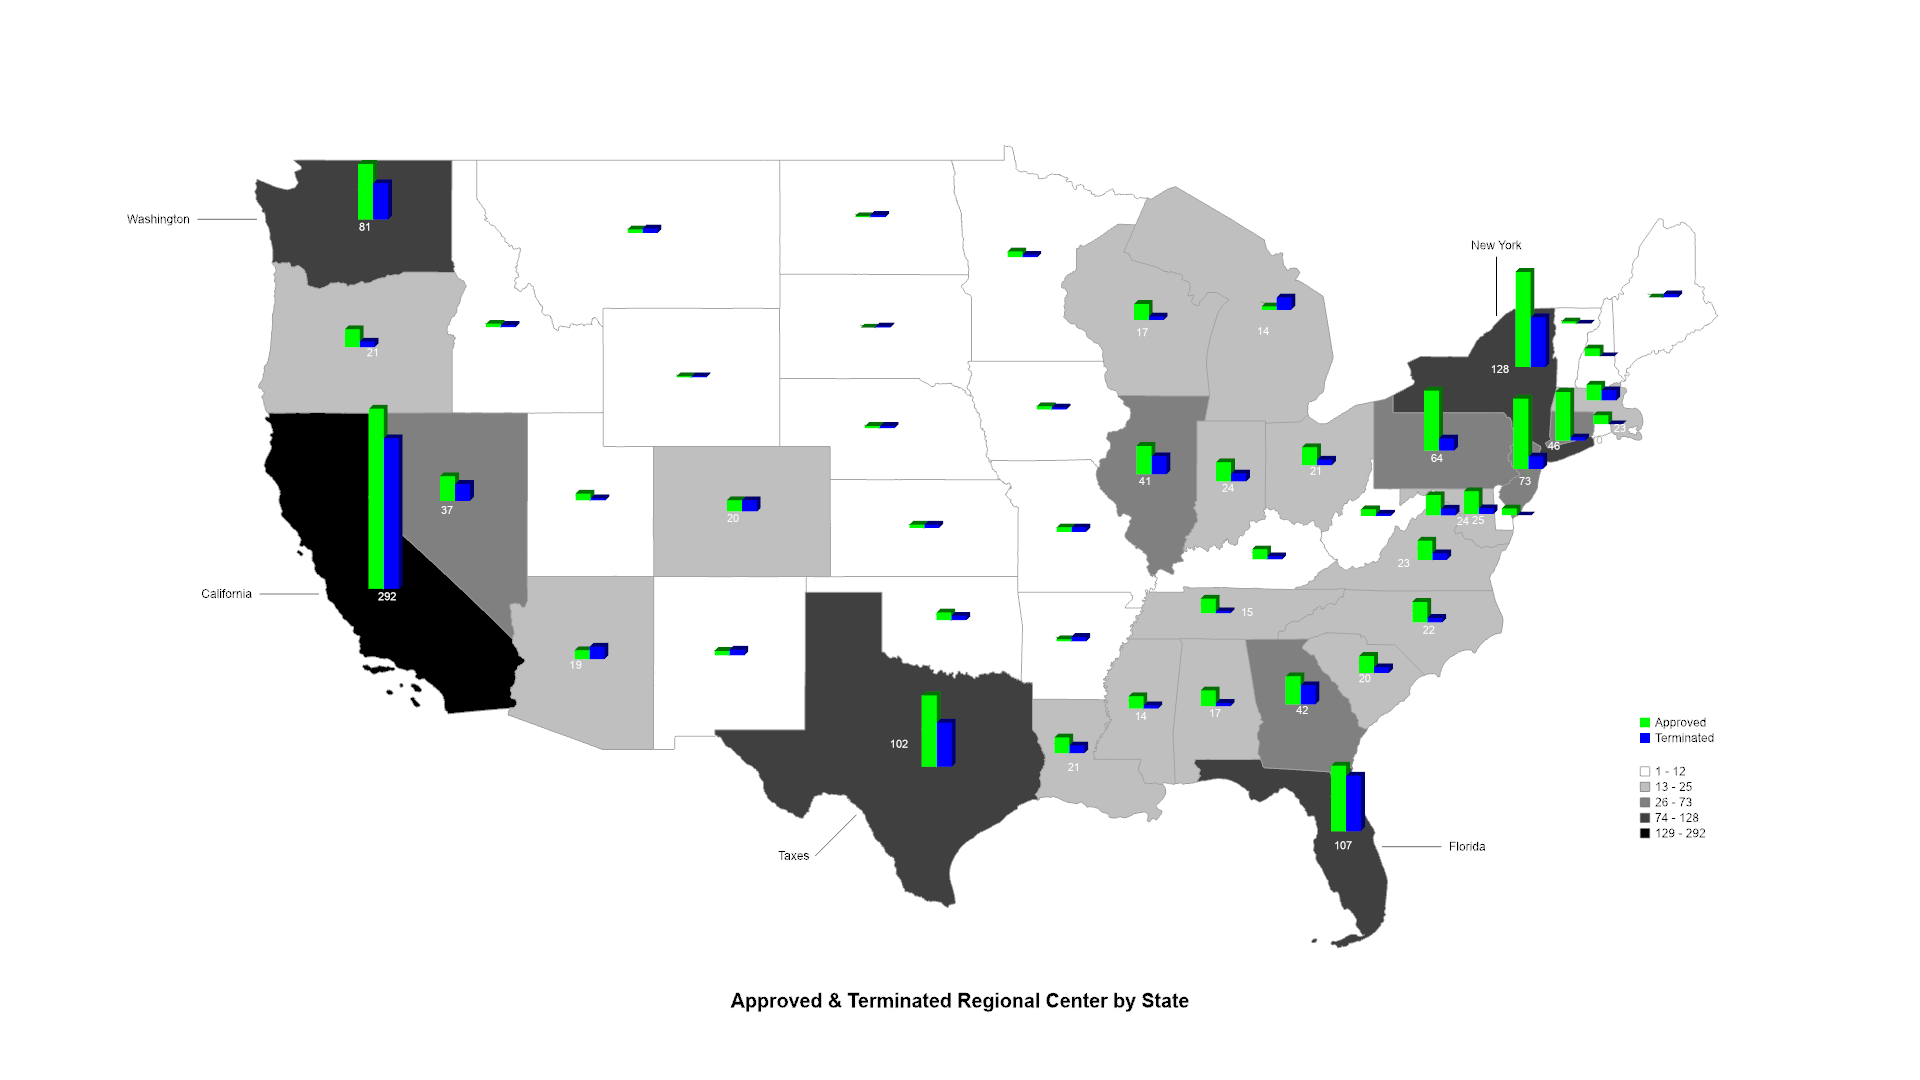
The chart shows a summary of approved and terminated regional centers by state, indicating the number of ever-existing regional centers. California, New York, and Florida are the top three destinations for regional center registration.
2. EB-5 Capital Structure
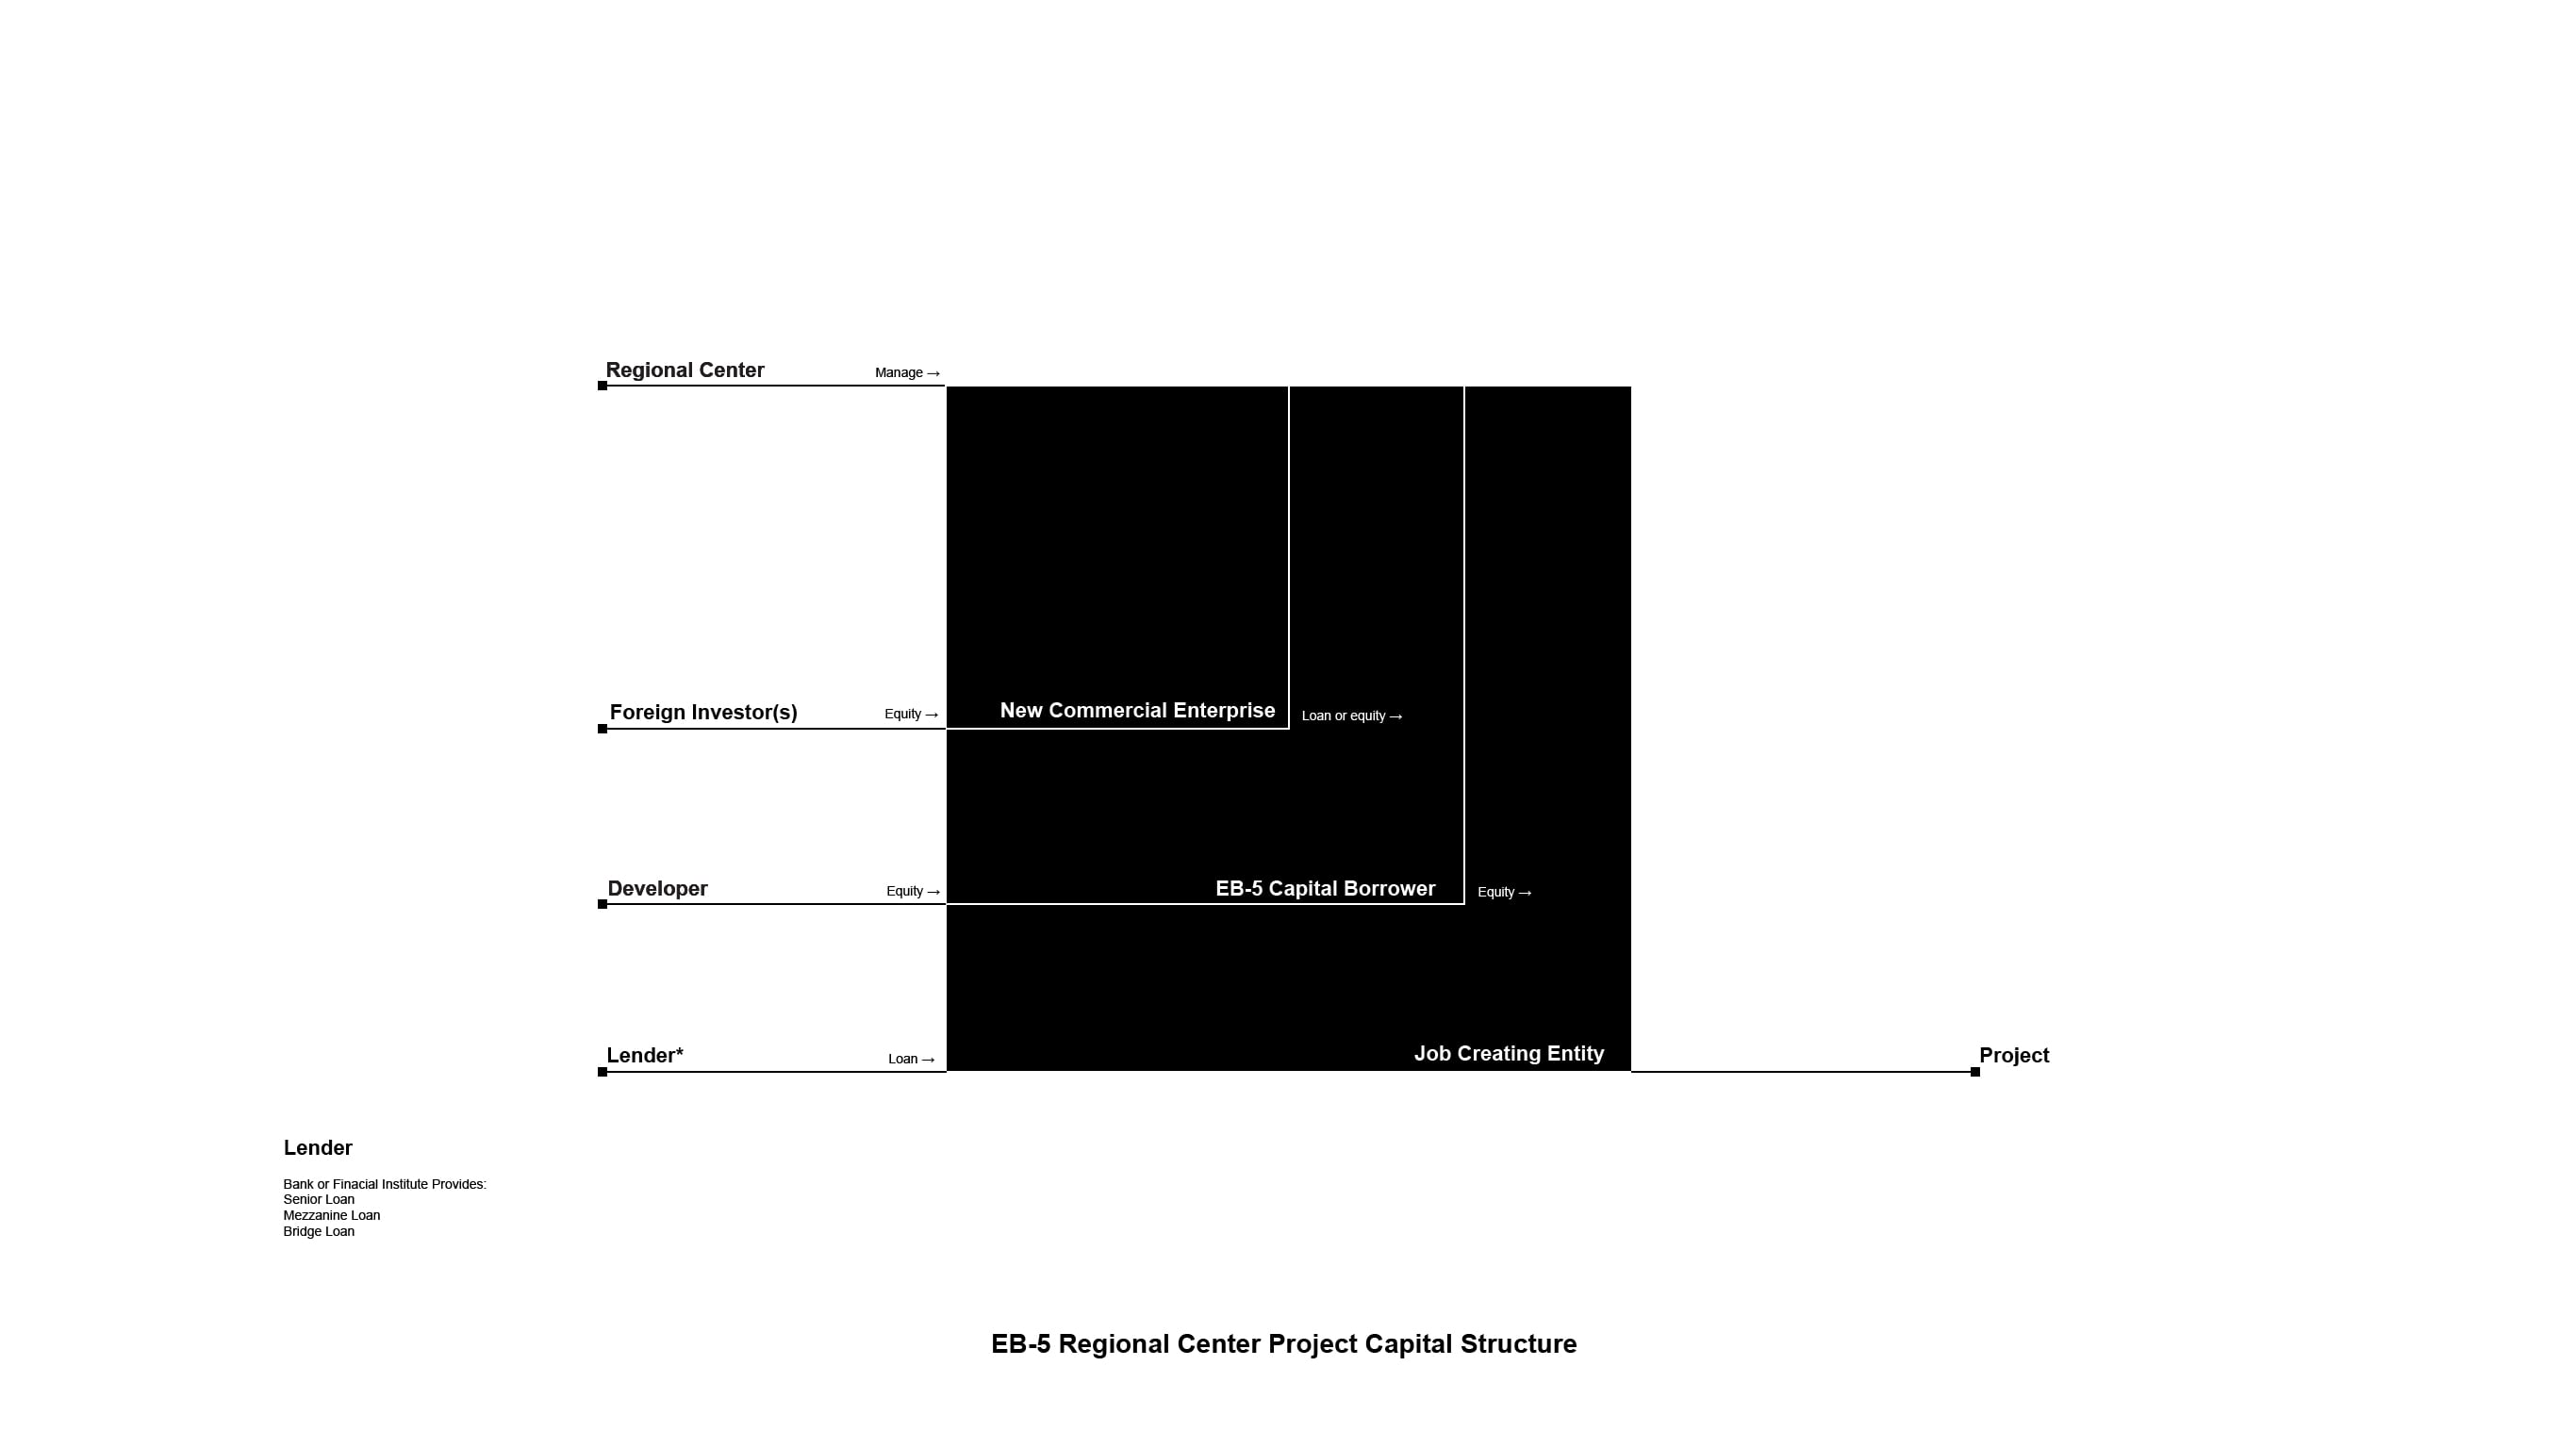
Funding a regional center project is a step-by-step process, and EB-5 capital is only one of the many sources of a project's capital stack. Usually, it takes from 10% to 30% of the entire project cost. The diagram shows the typical funding structure for an EB-5 project. First, a regional center manages NCE that collects funds from foreign investors as equity. Second, NCE lends the funds as a loan or finances them as equity for the intermediary borrower, LLC. The developer will also fund the borrower, LLC in an equity model. Finally, the borrower, LLC will finance the collected funds as equity to JCE. The JCE will also borrow from traditional financial institutions, which represent the majority of the project's overall cost.
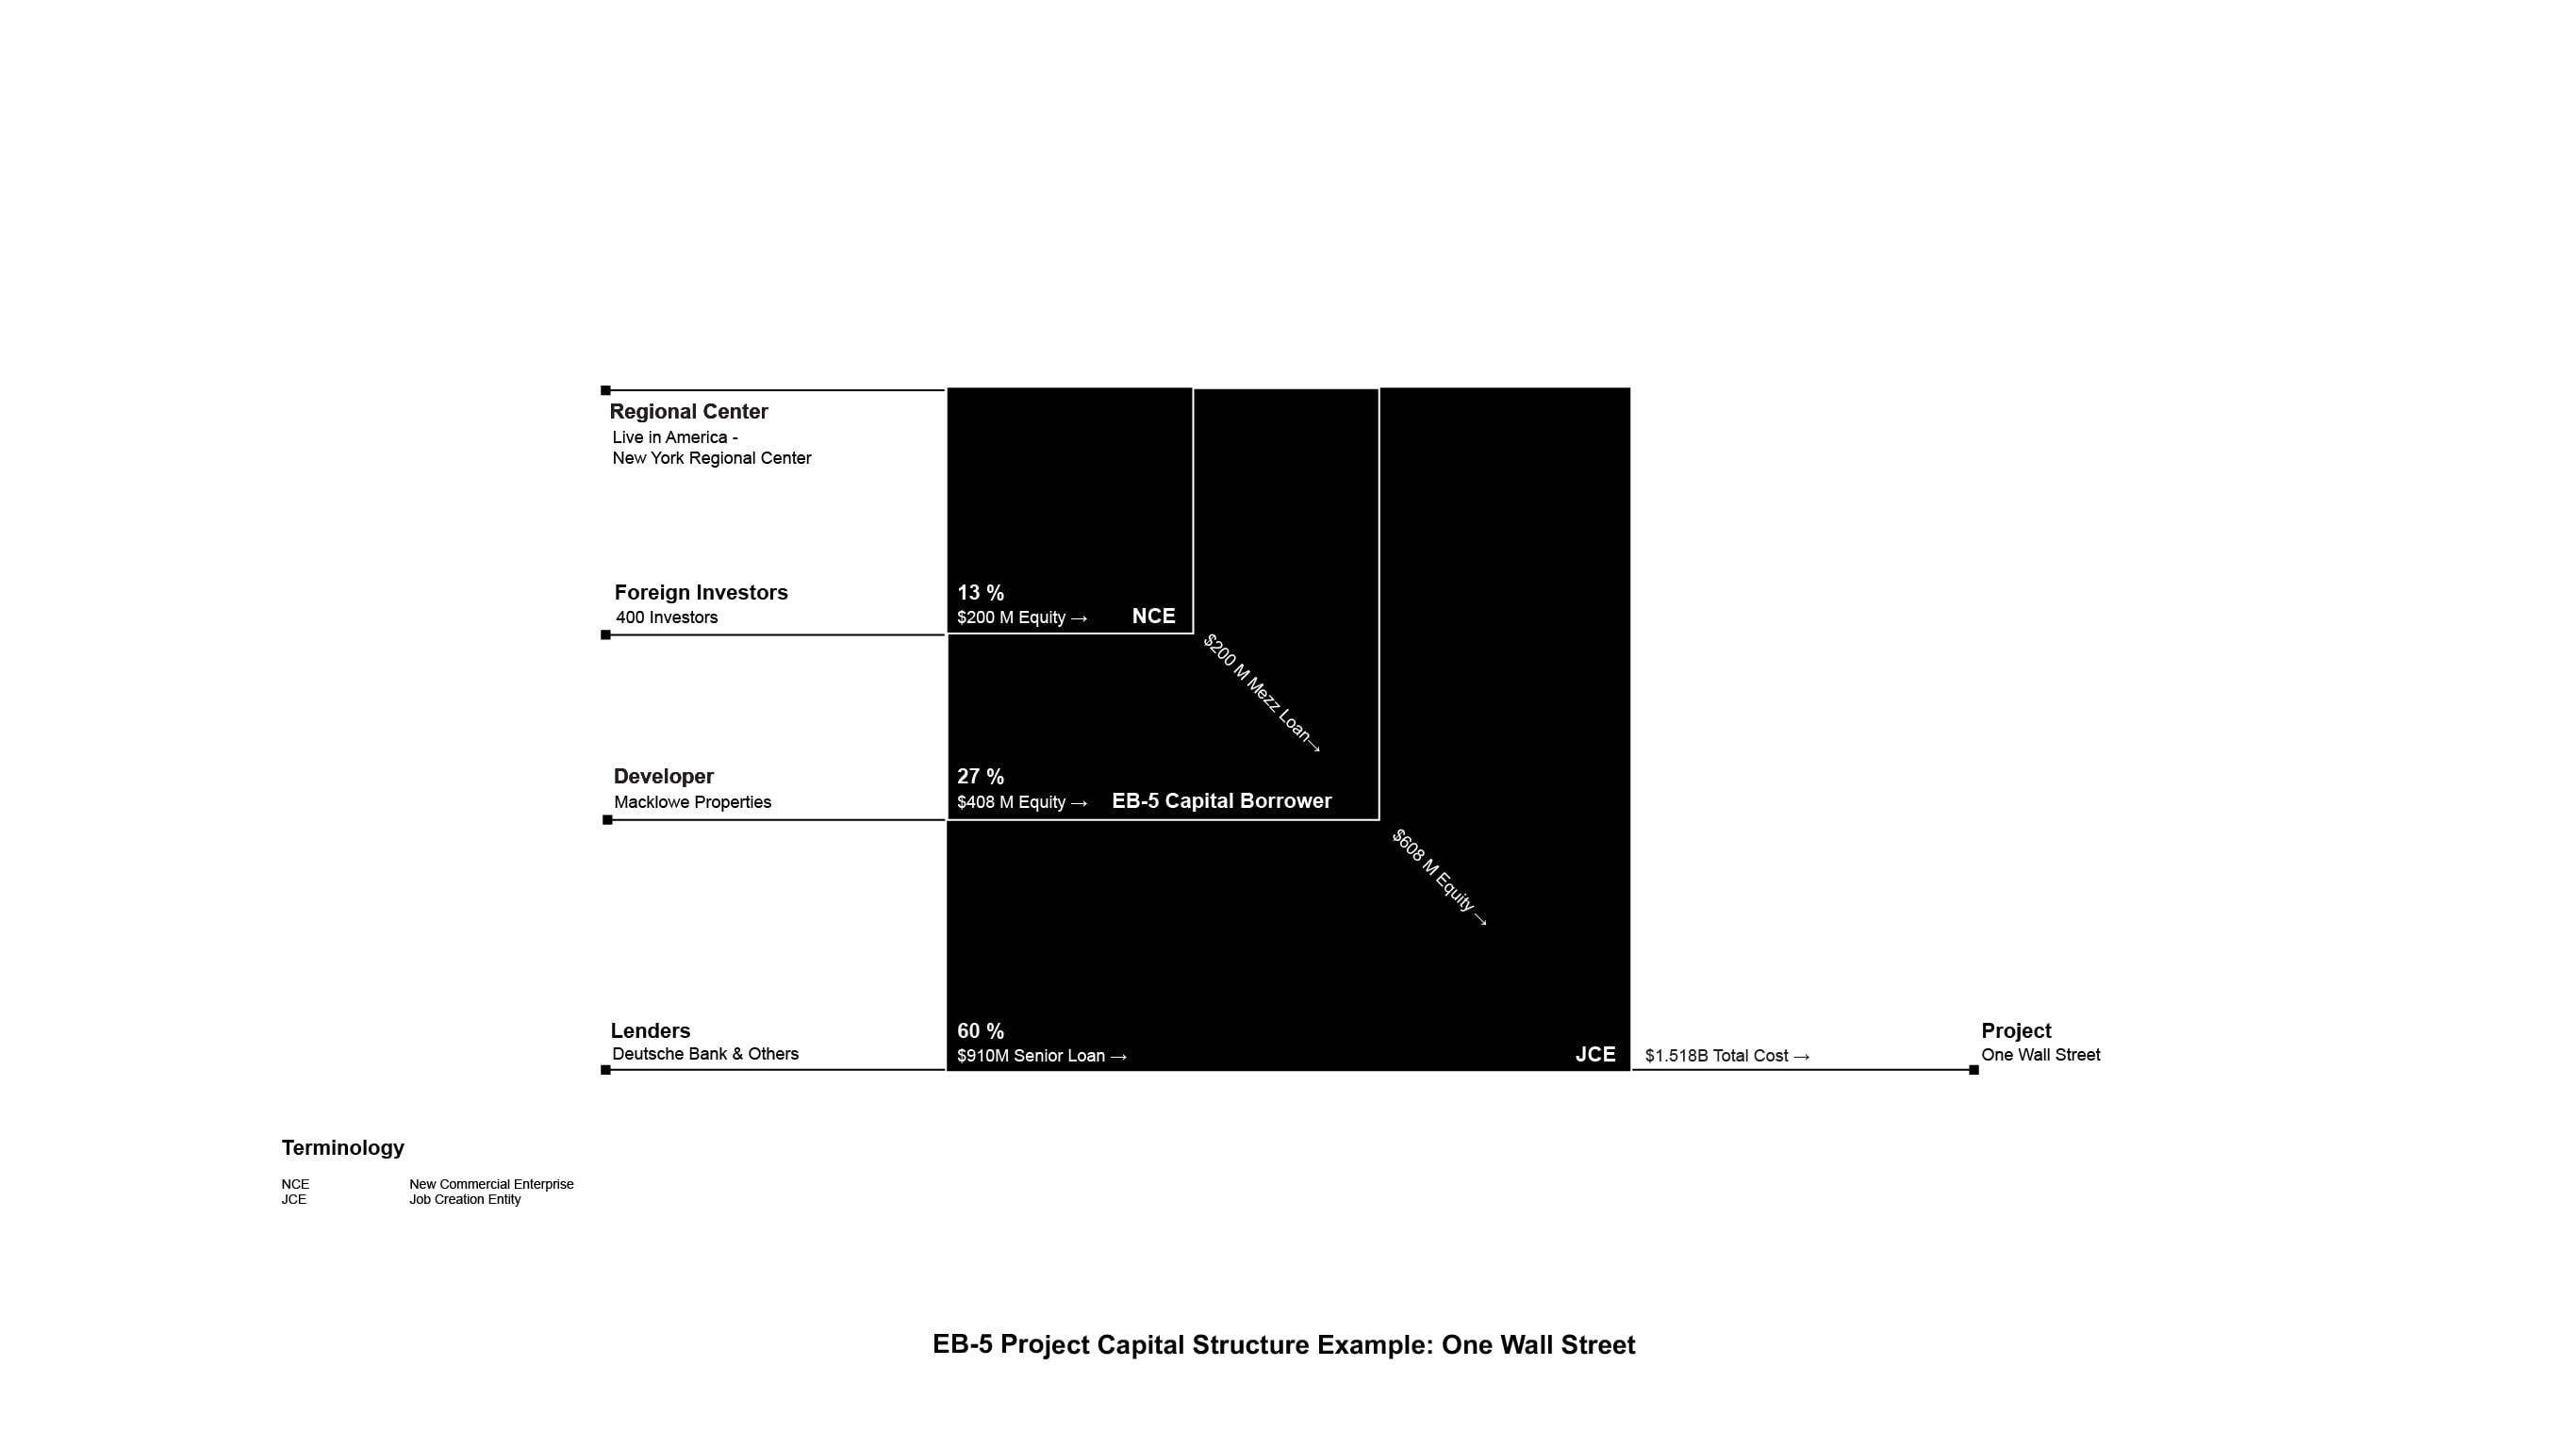
The diagram shows the capital structure example of One Wall Street.
3. EB-5 Regional Center Model
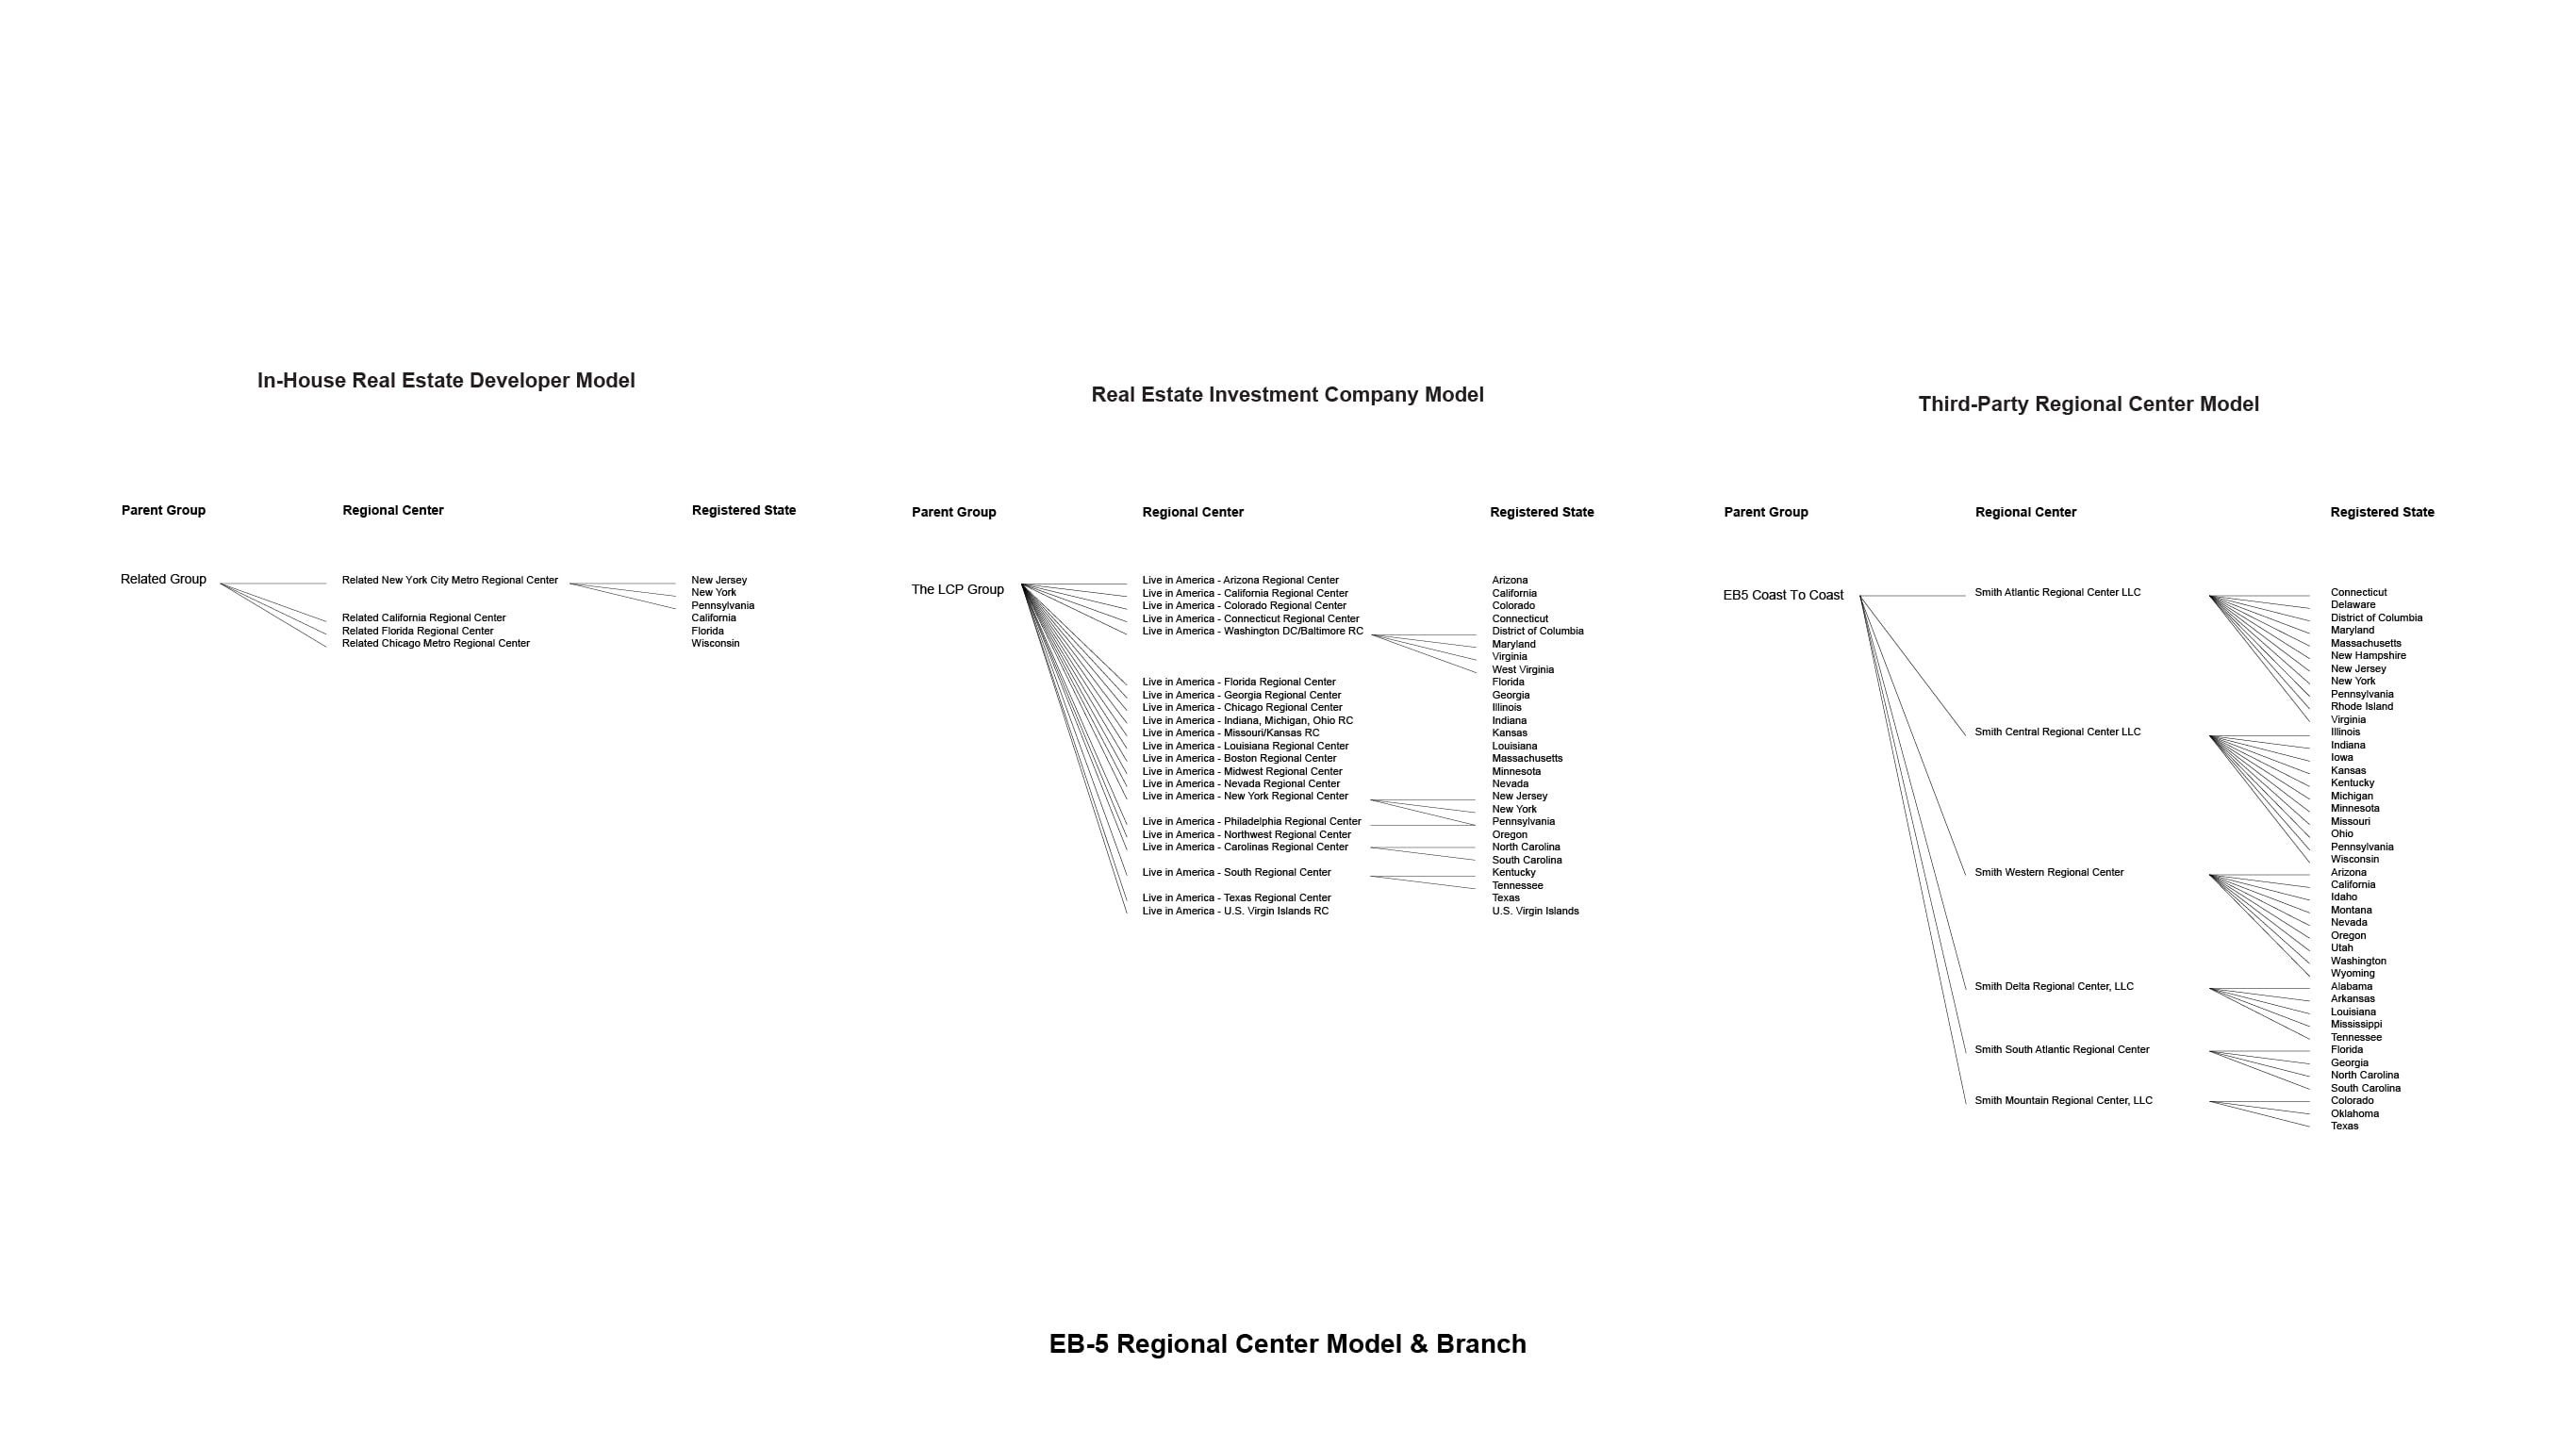
There are three regional center models that conduct projects with different orientations. The background of the phenomenon is that a regional center can only help develop projects in confined geographic areas by county. Therefore, many regional centers register their companies in different states to maximize outreach. The first model is the in-house real estate developer model. In this method, a developer registers different regional centers in different states to subordinate the parent company’s development goal. For example, The Related Group is a Florida-based real estate firm that has regional centers in New York and California. The second model is real estate finance and investment companies. Their goal is to fund many real estate projects and obtain investment returns. The third model is the most common third-party regional center model, which serves as a sponsor and intermediary for sourcing funds. They obtain their returns through partnered fees, management, or renting regional centers for developers.
Part 3: The Atlas of the Development
This part aims to uncover the detailed local projects' relationships and geographic patterns.
1. EB-5 Regional Center Affiliation Network
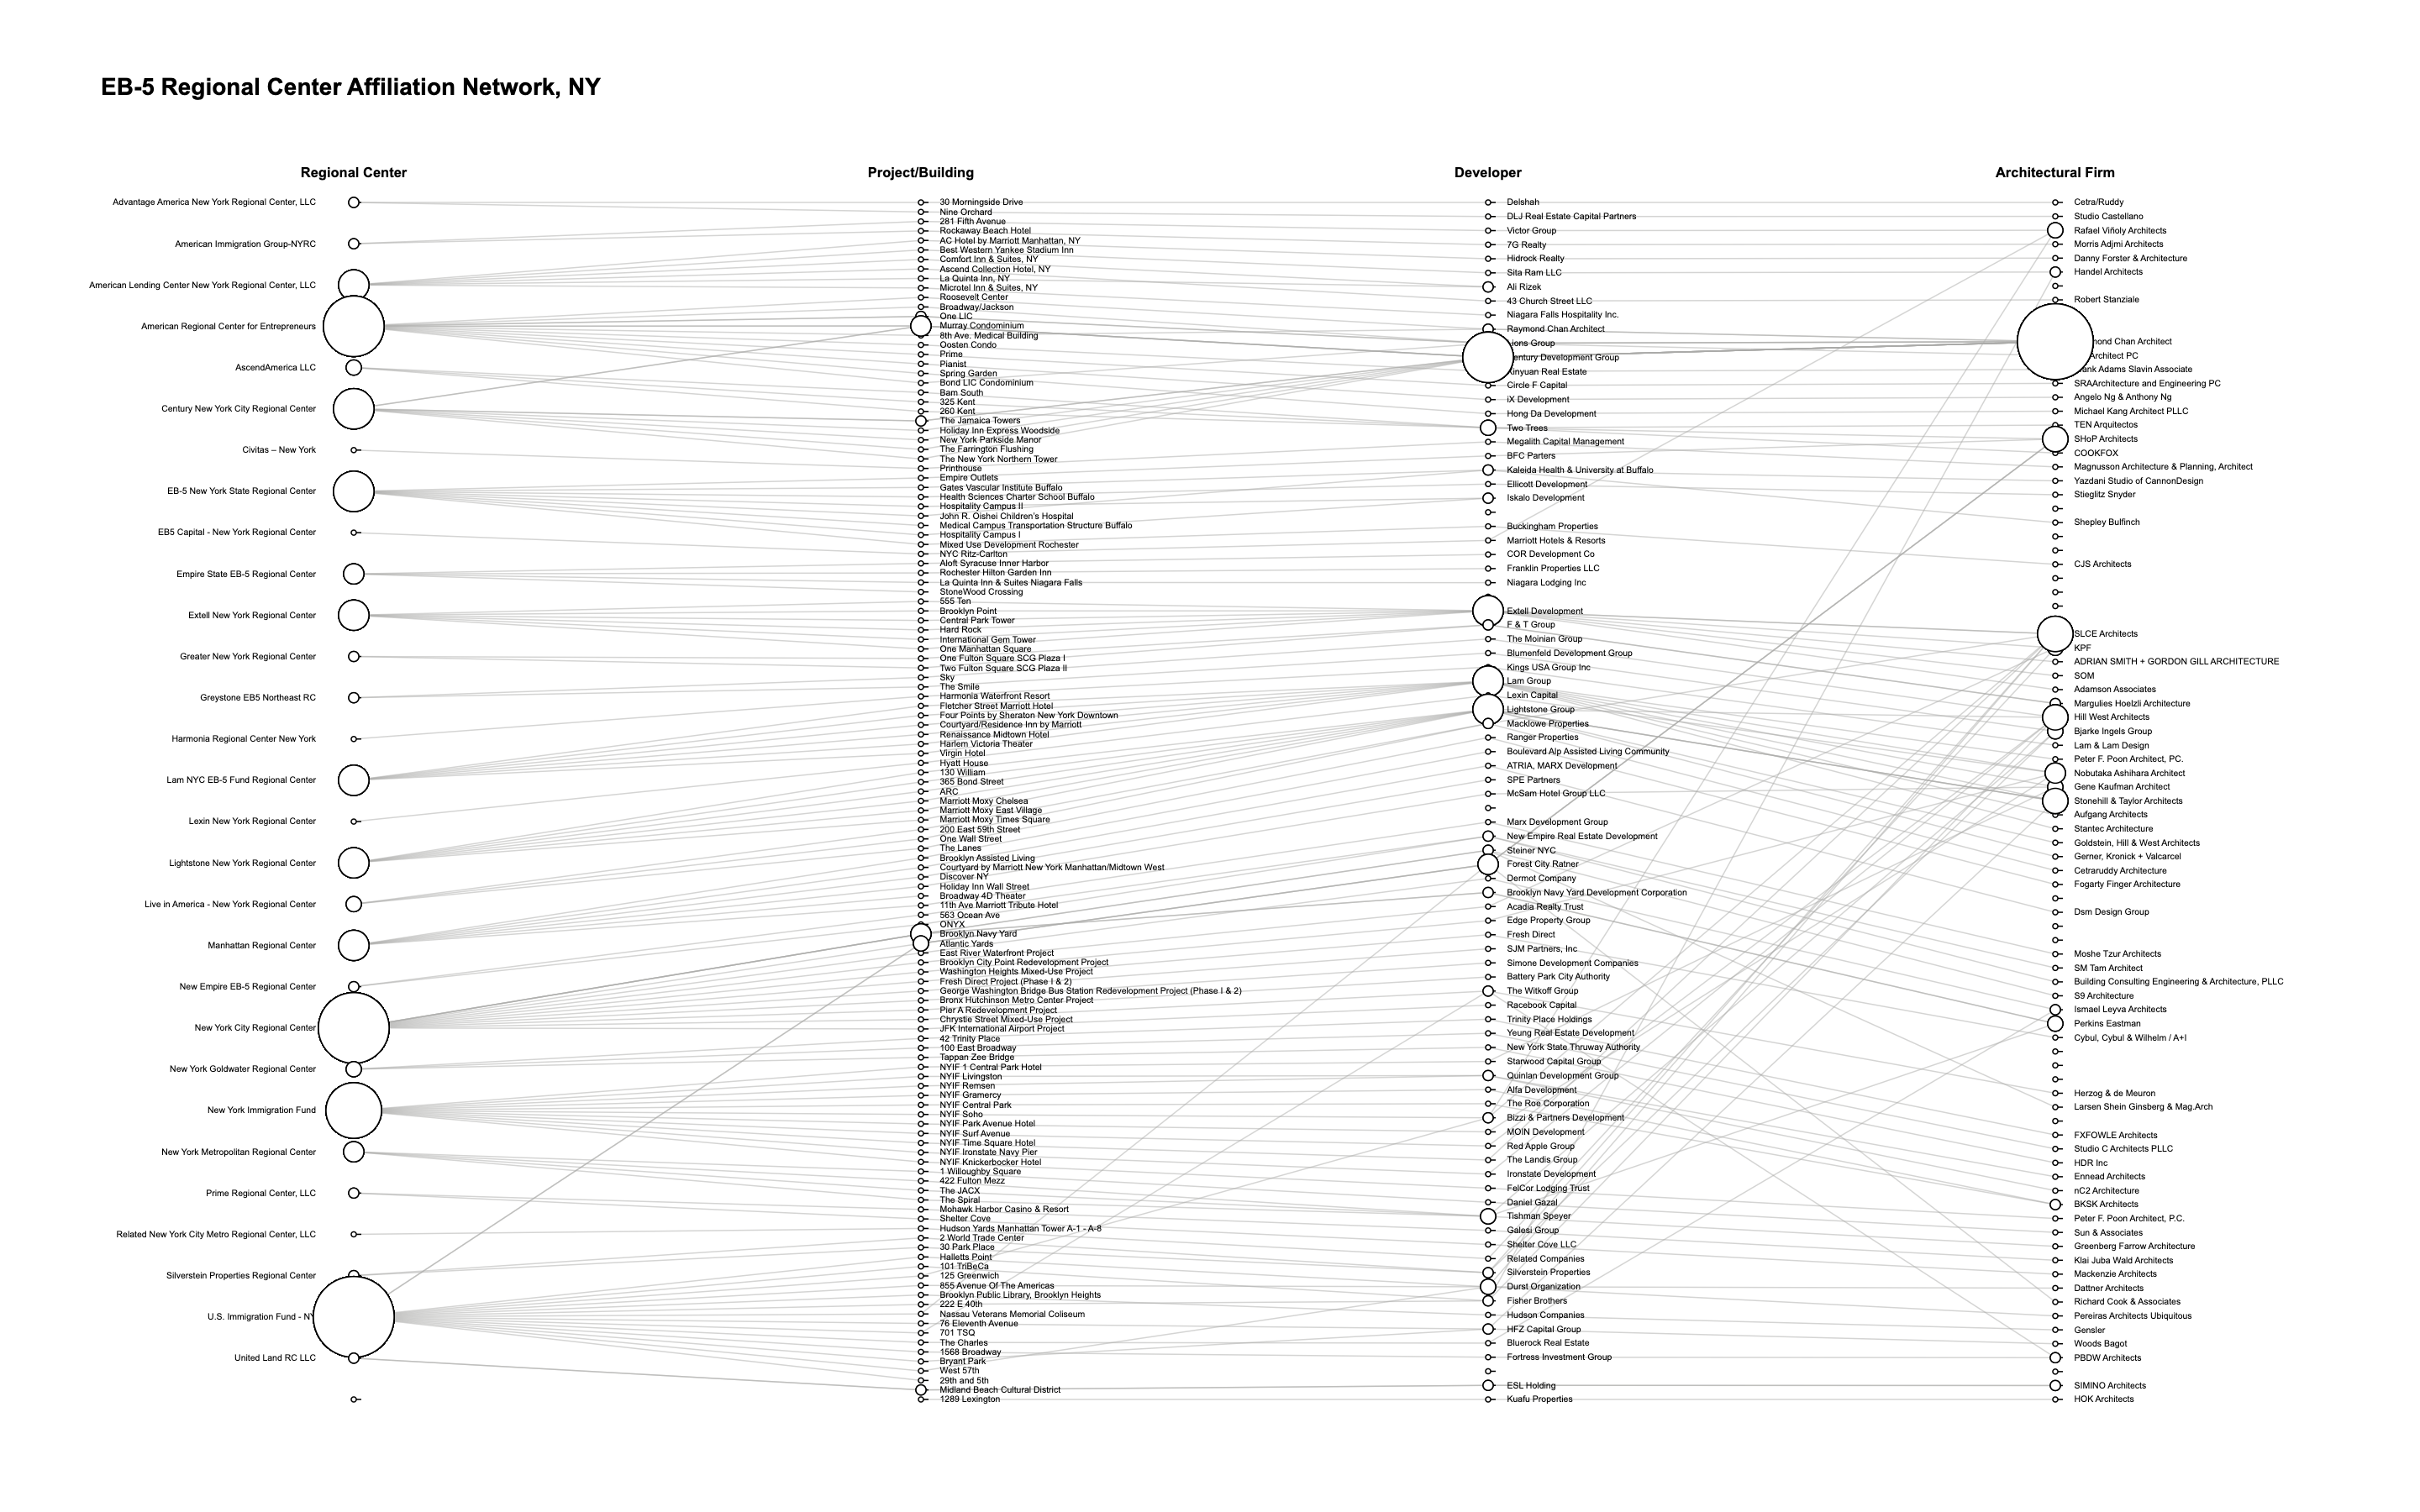
The network shows the relationships between the regional center, EB-5 projects, developers, and architecture firms in New York. New York's regional center projects are evenly distributed among different regional centers and developers. The New York City Regional Center helped finance mostly expensive governmental, urban renewal, or quasi-public projects, such as the Barclay Center Arena, George Washington Bridge Bus Terminal, and Brooklyn Navy Yard development. The U.S. Immigration Fund - NY helped finance many luxury condos and hotels, such as The Charles and One High Line Condominiums. The American Regional Center for Entrepreneurs facilitated many mid-scale projects related to Chinese and Jewish family-run developers, such as Century Development Group and Lions Group. The Extell New York Regional Center worked under Extell Development Company and helped finance many high-rises, such as the Central Park Tower.
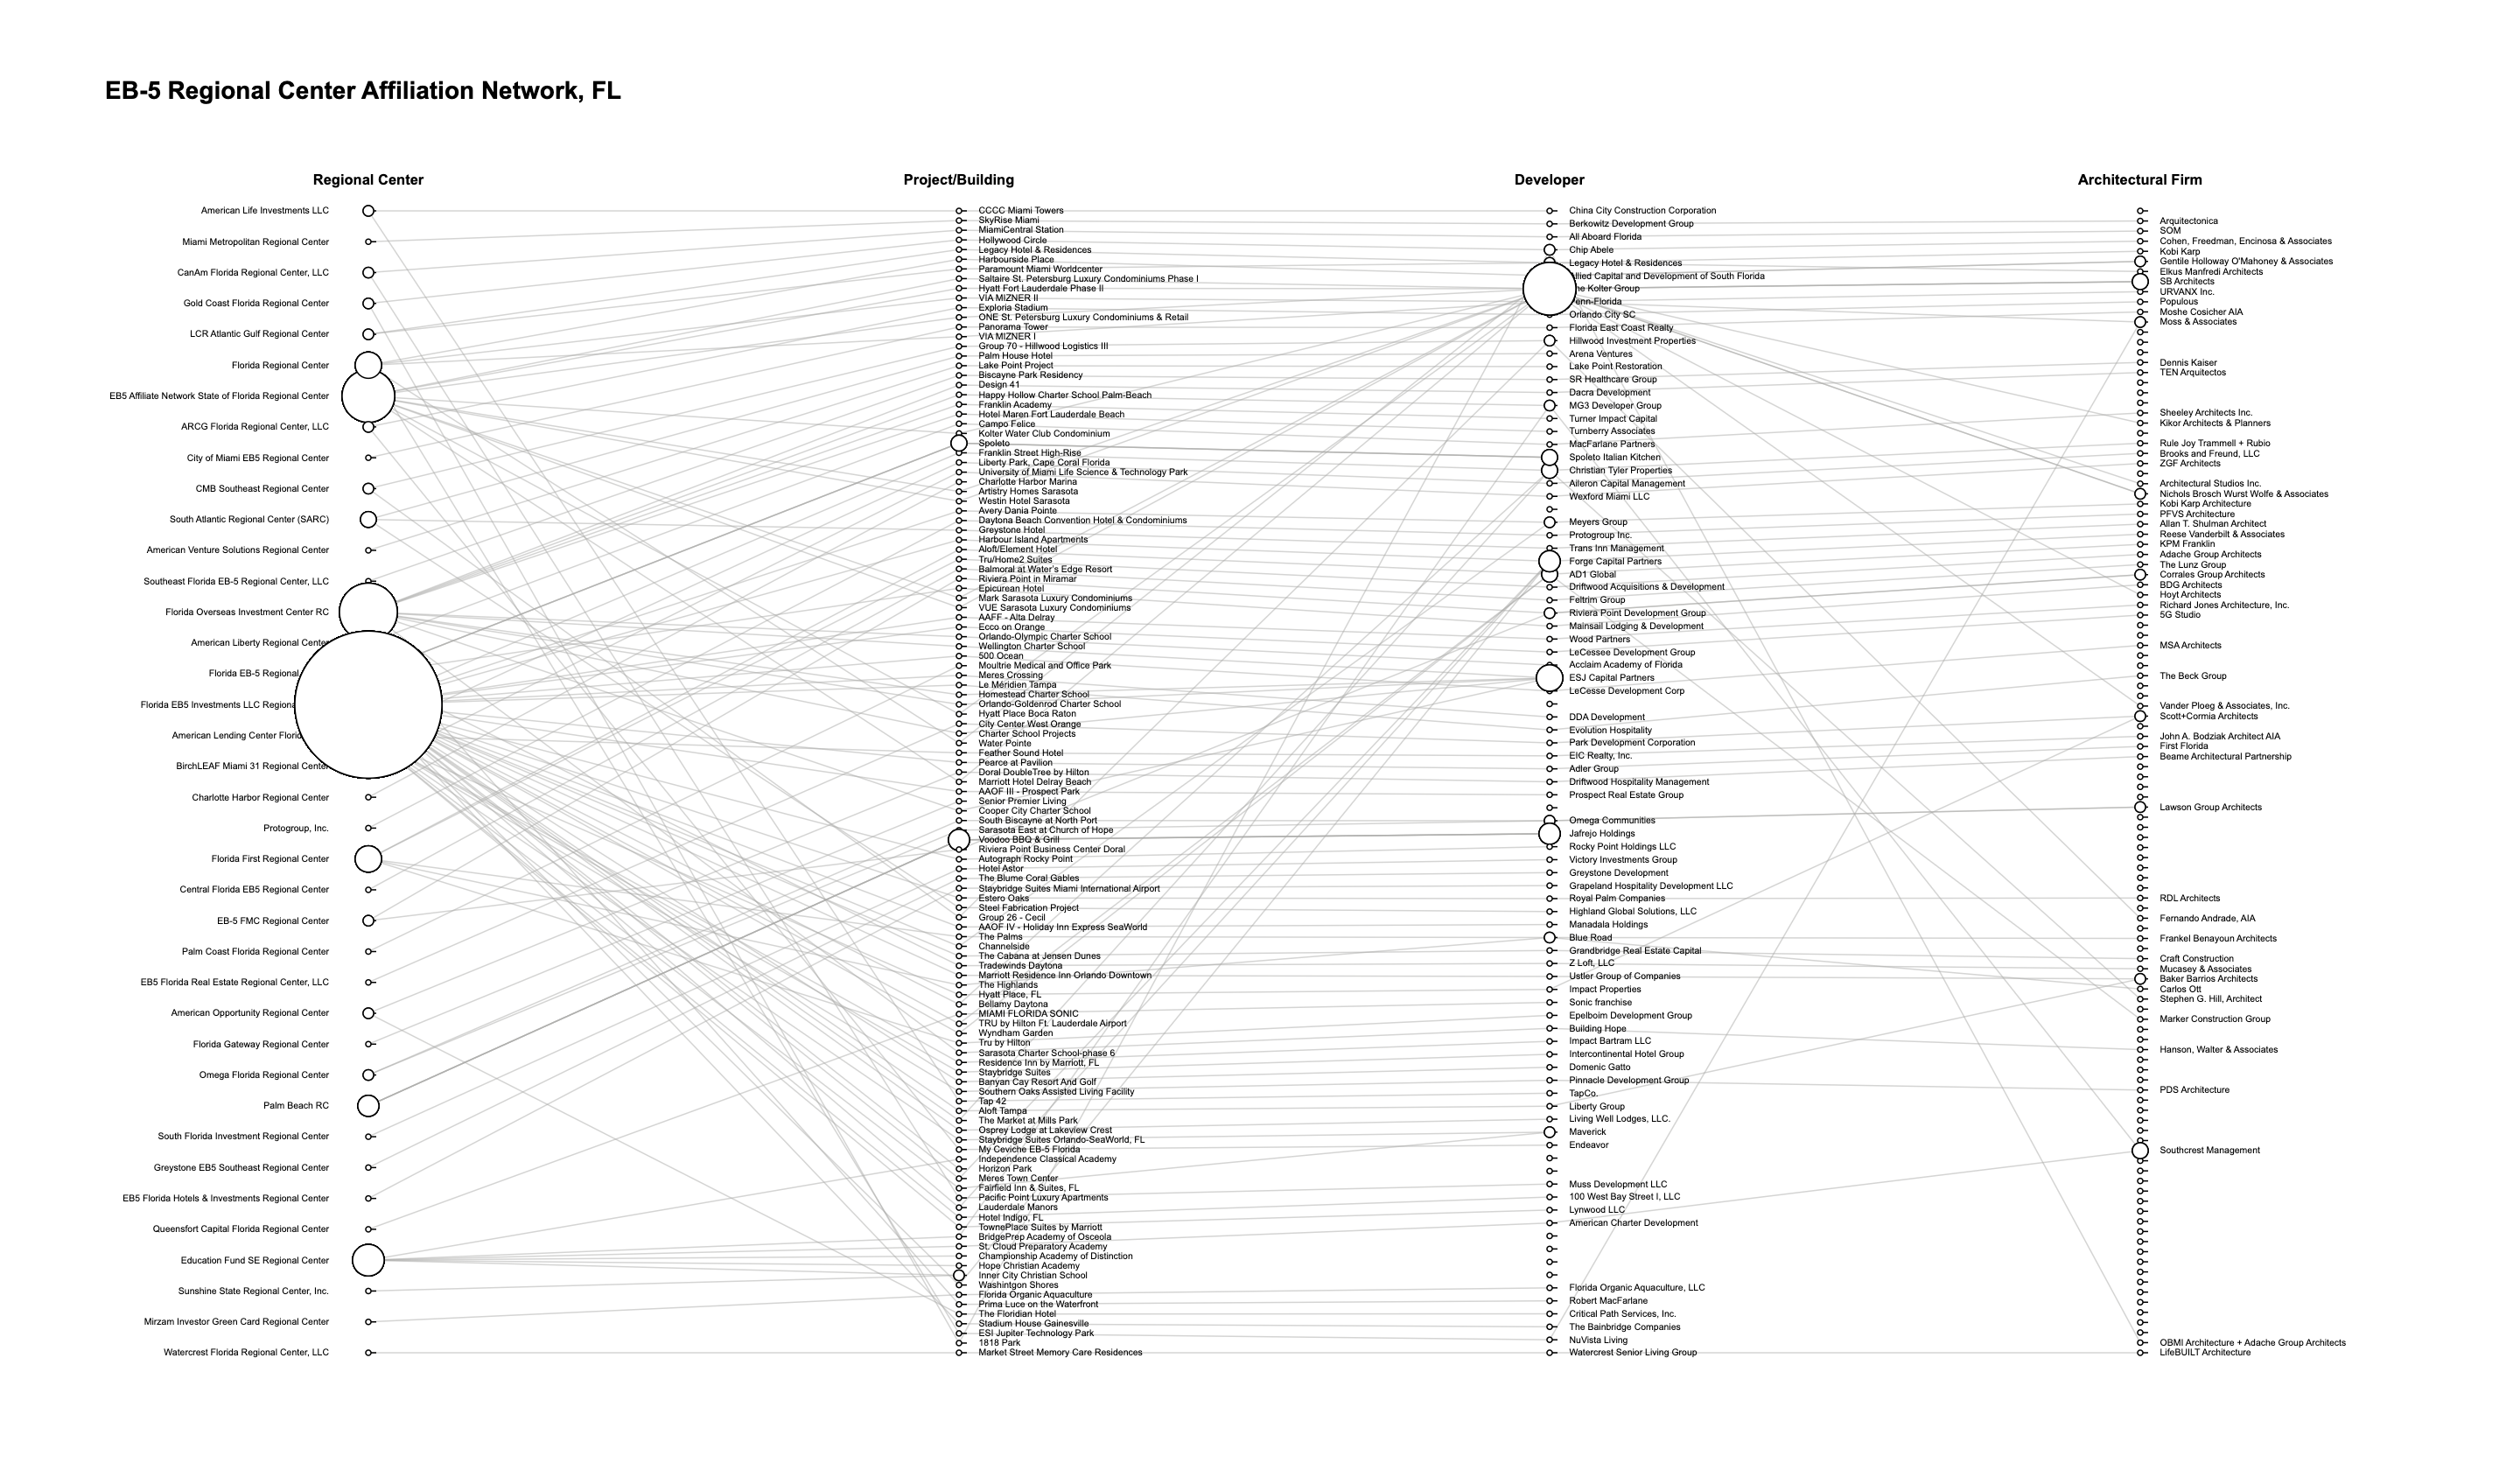
The network shows the relationships between the regional center, EB-5 projects, developers, and architecture firms in Florida. Florida EB5 Investment LLC Regional Center has facilitated 28 successful projects, outnumbering many other regional centers. The Kolter Group is the top developer that utilized the EB-5 capital to develop hotels and condos.
2. Map of EB-5 Project
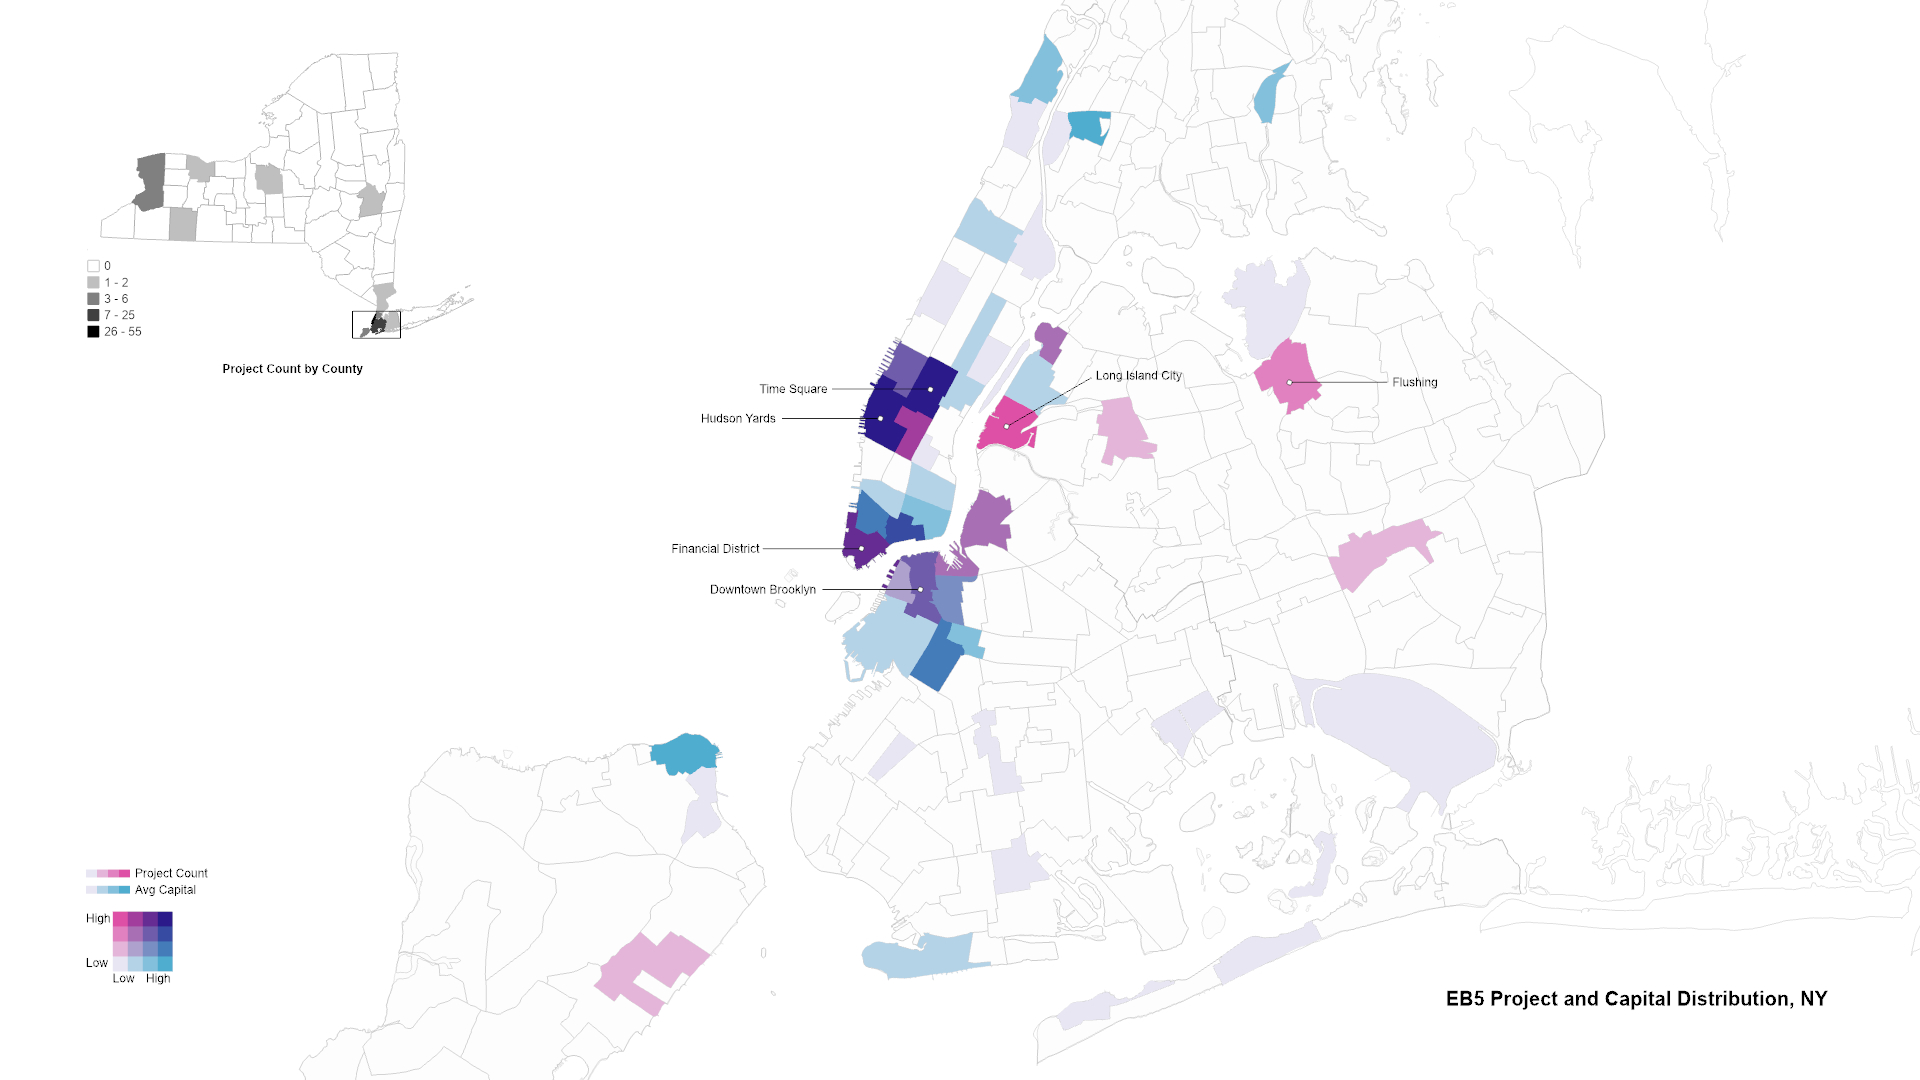
The map provides a summary of EB-5 projects in New York City, categorized by location and capital investment. The primary project locations include Midtown, the Financial District in Manhattan, Downtown Brooklyn, and Long Island City in Queens. Times Square and Hudson Yards have the highest project count and average EB-5 capital. Long Island City and Flushing, on the other hand, have a high project count with relatively low EB-5 investment.
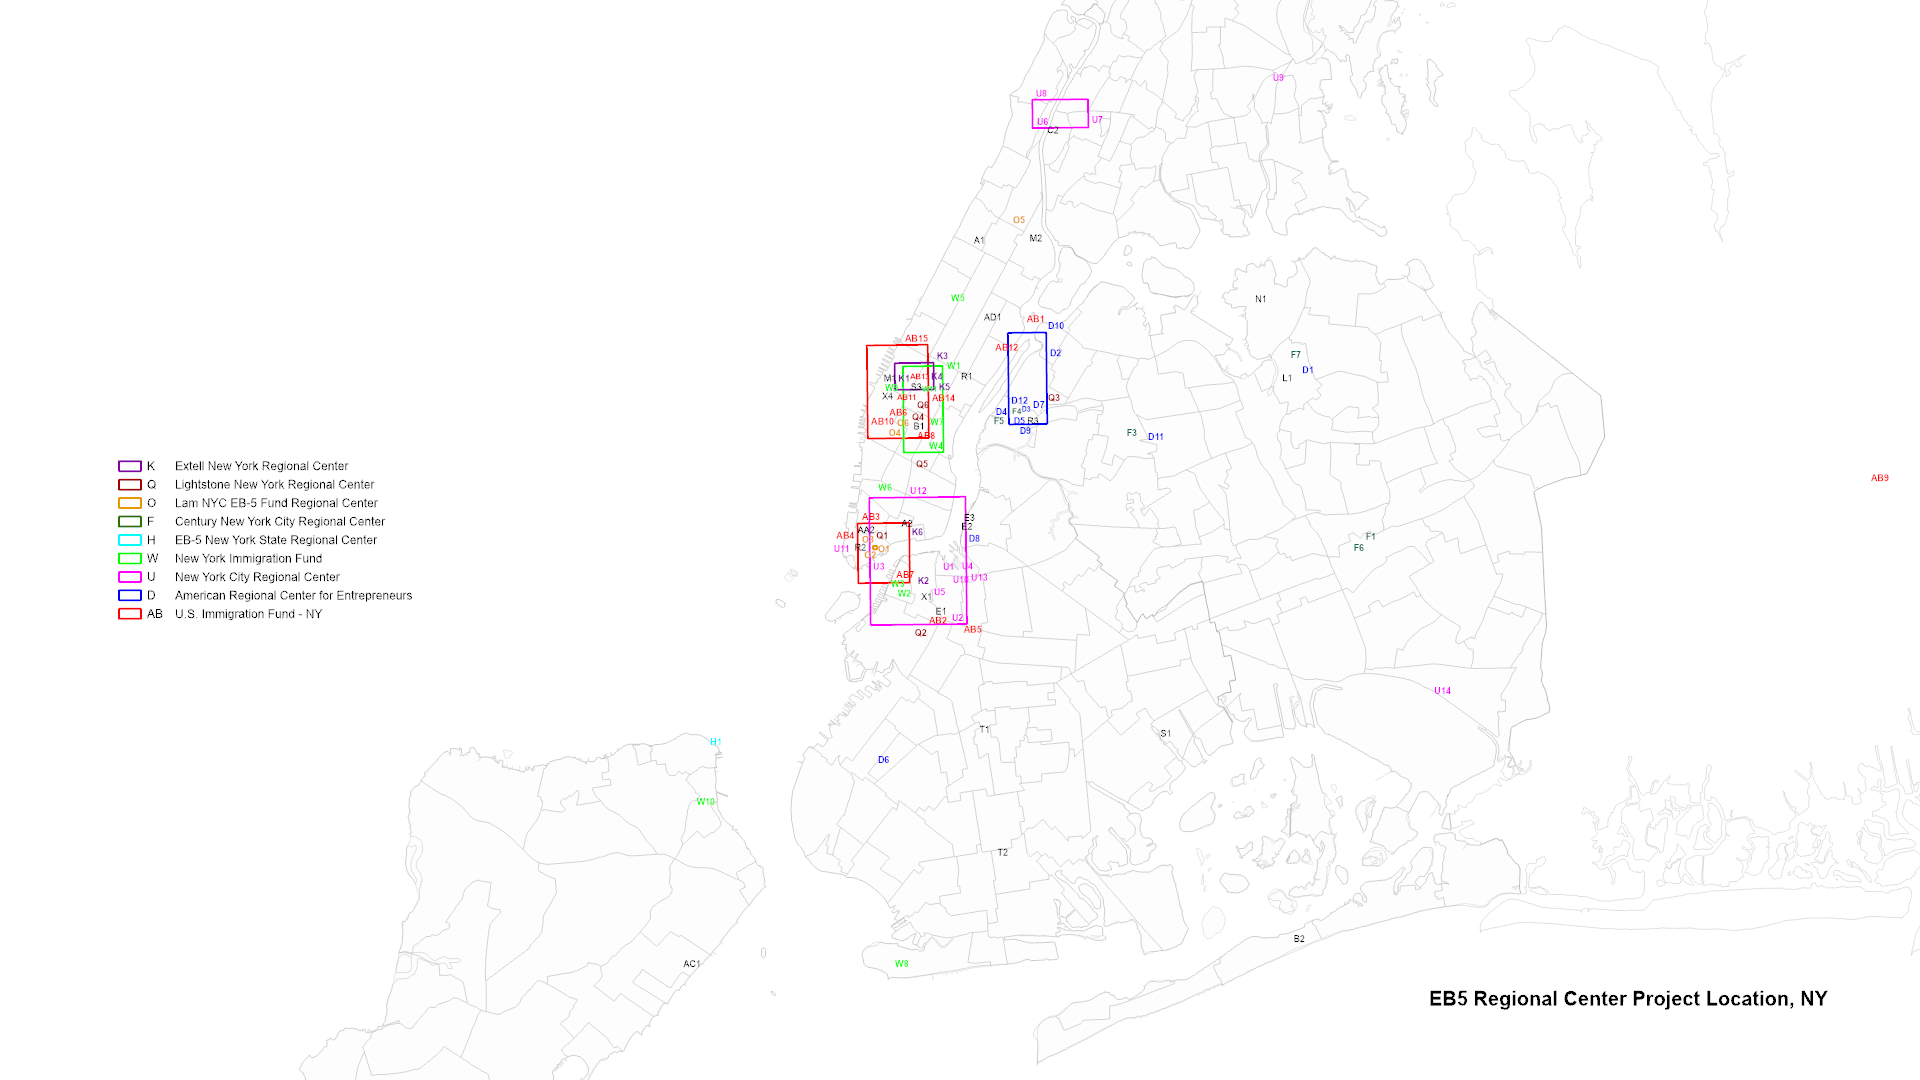
The map displays the locations of EB-5 projects, each identified by a unique project ID. Colored IDs indicate projects that were financed by top regional centers, while colored polygons represent projects developed in close proximity by the same regional center. U.S. Immigration Fund-NY (AB) helped finance many projects in the Time Square-Midtown area. The New York City Regional Center (U) helped finance many projects in Downtown Brooklyn. American Regional Center for Entrepreneurs (D) focused on Long Island City and other borough projects.
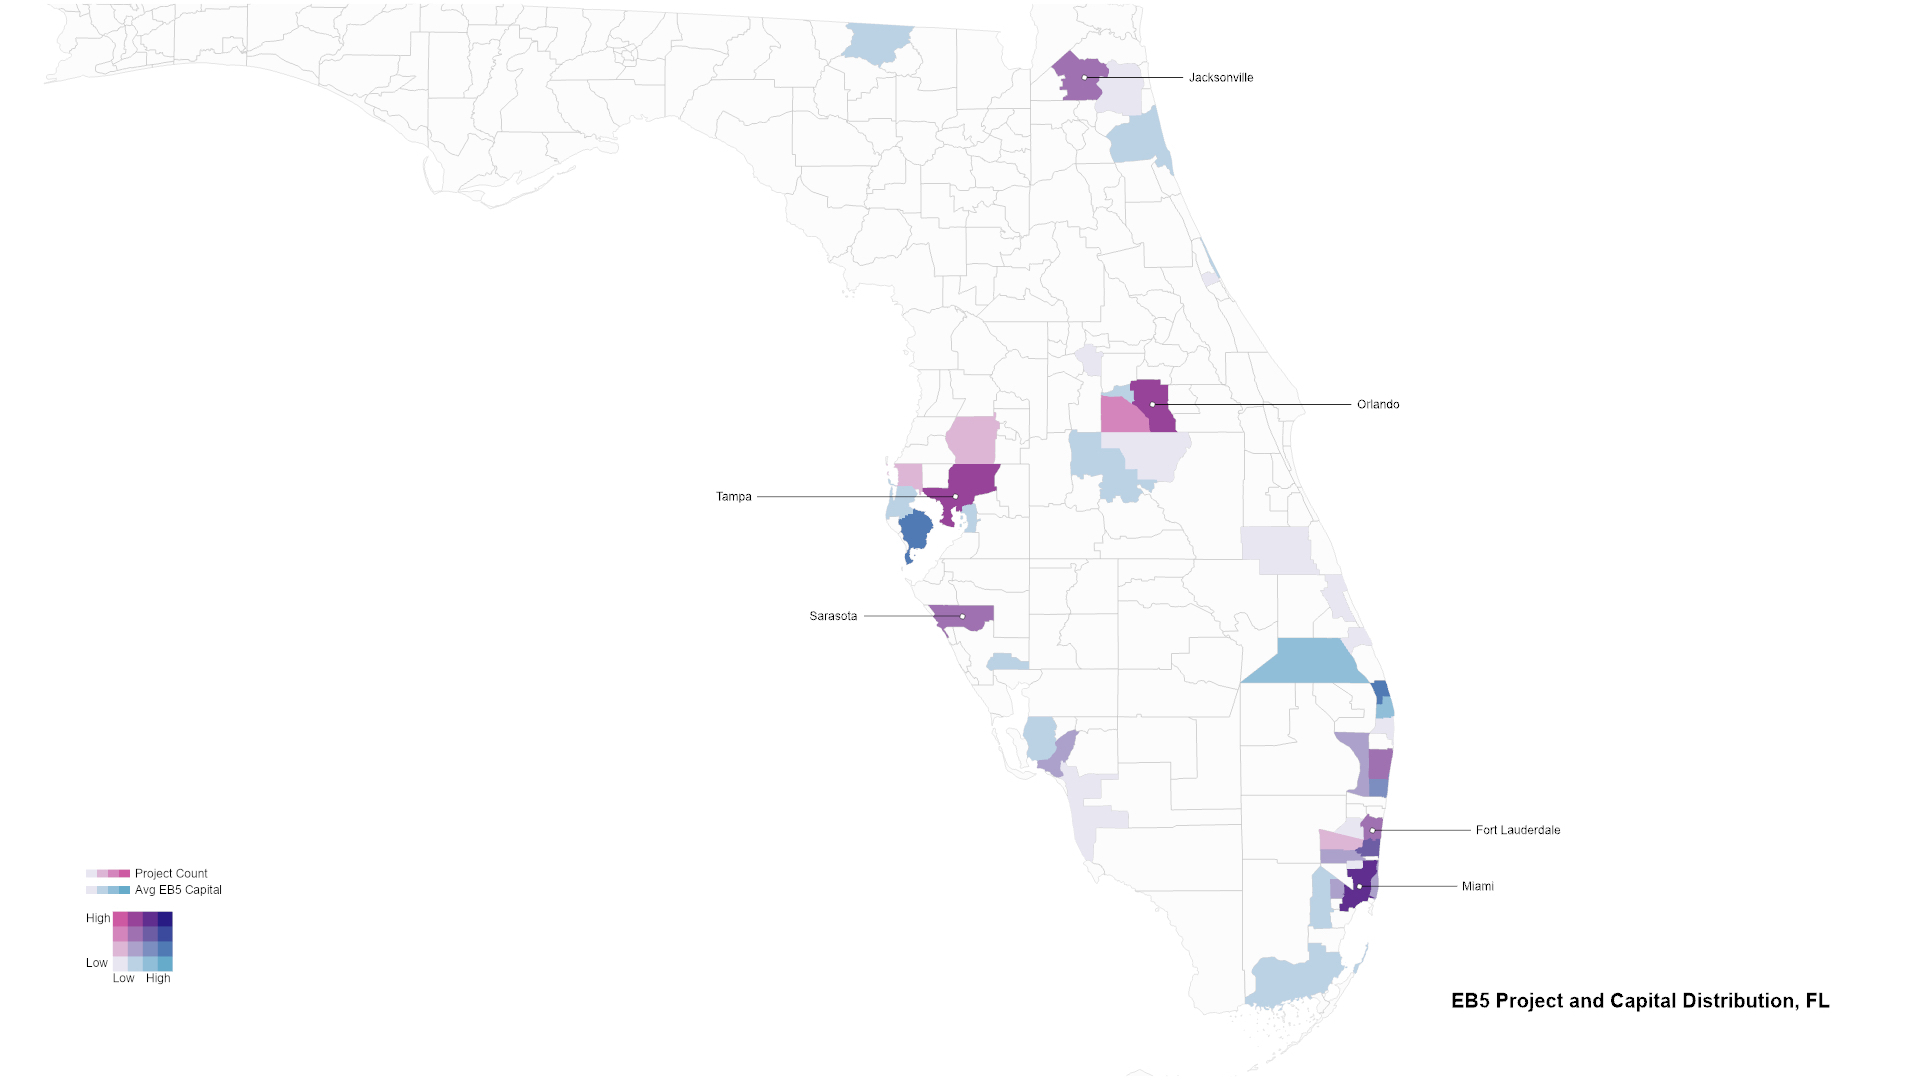
The map summarizes EB-5 projects in Florida by location and capital. Key project locations include Miami, Fort Lauderdale, Orlando, and Tampa. Miami stands out with both the highest project count and the largest EB-5 investment project.
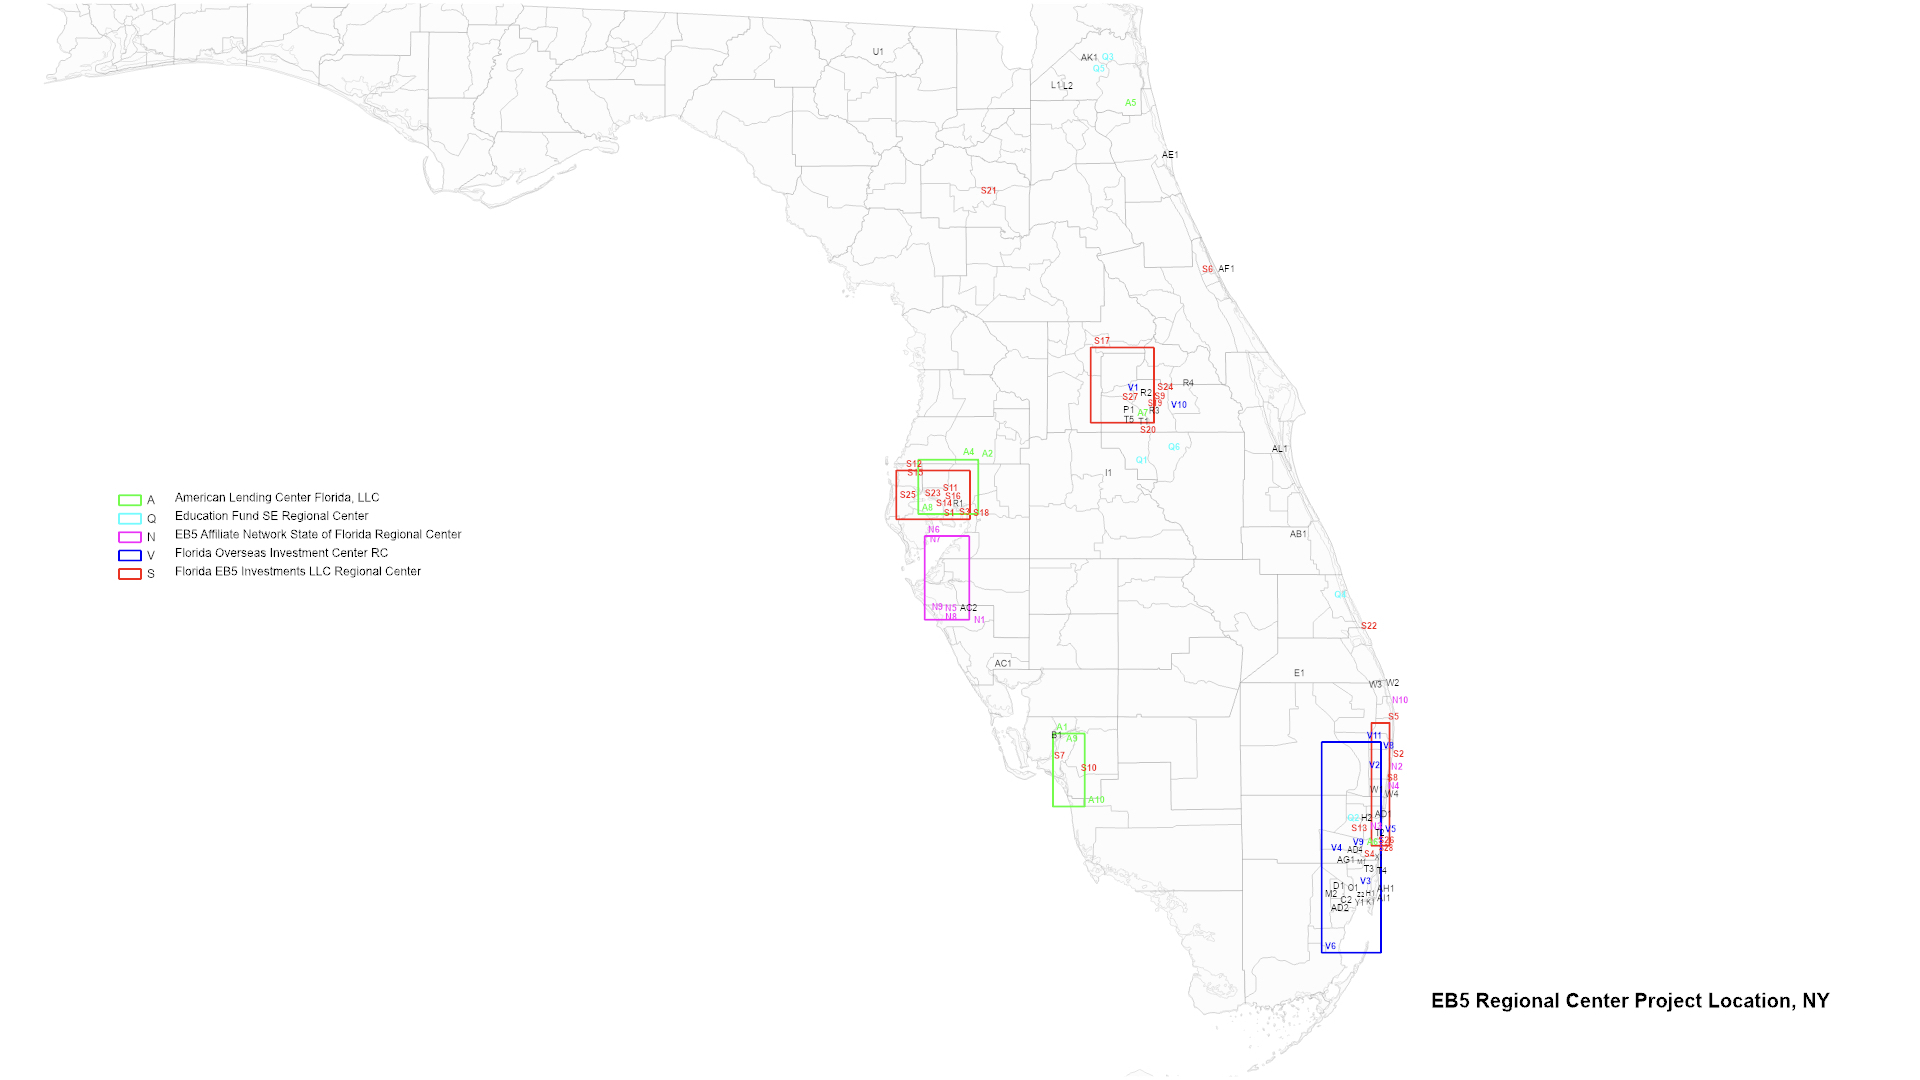
The map provides a visual representation of the geographic spread of Florida EB-5 projects. Miami and the golden coastline boast a high concentration of projects backed by the Florida Overseas Investment Center RC (V), while the Florida EB5 Investment LLC Regional Center (S) directed its focus toward Tampa and Orlando.
3. Satellite Imagery of EB-5 Project
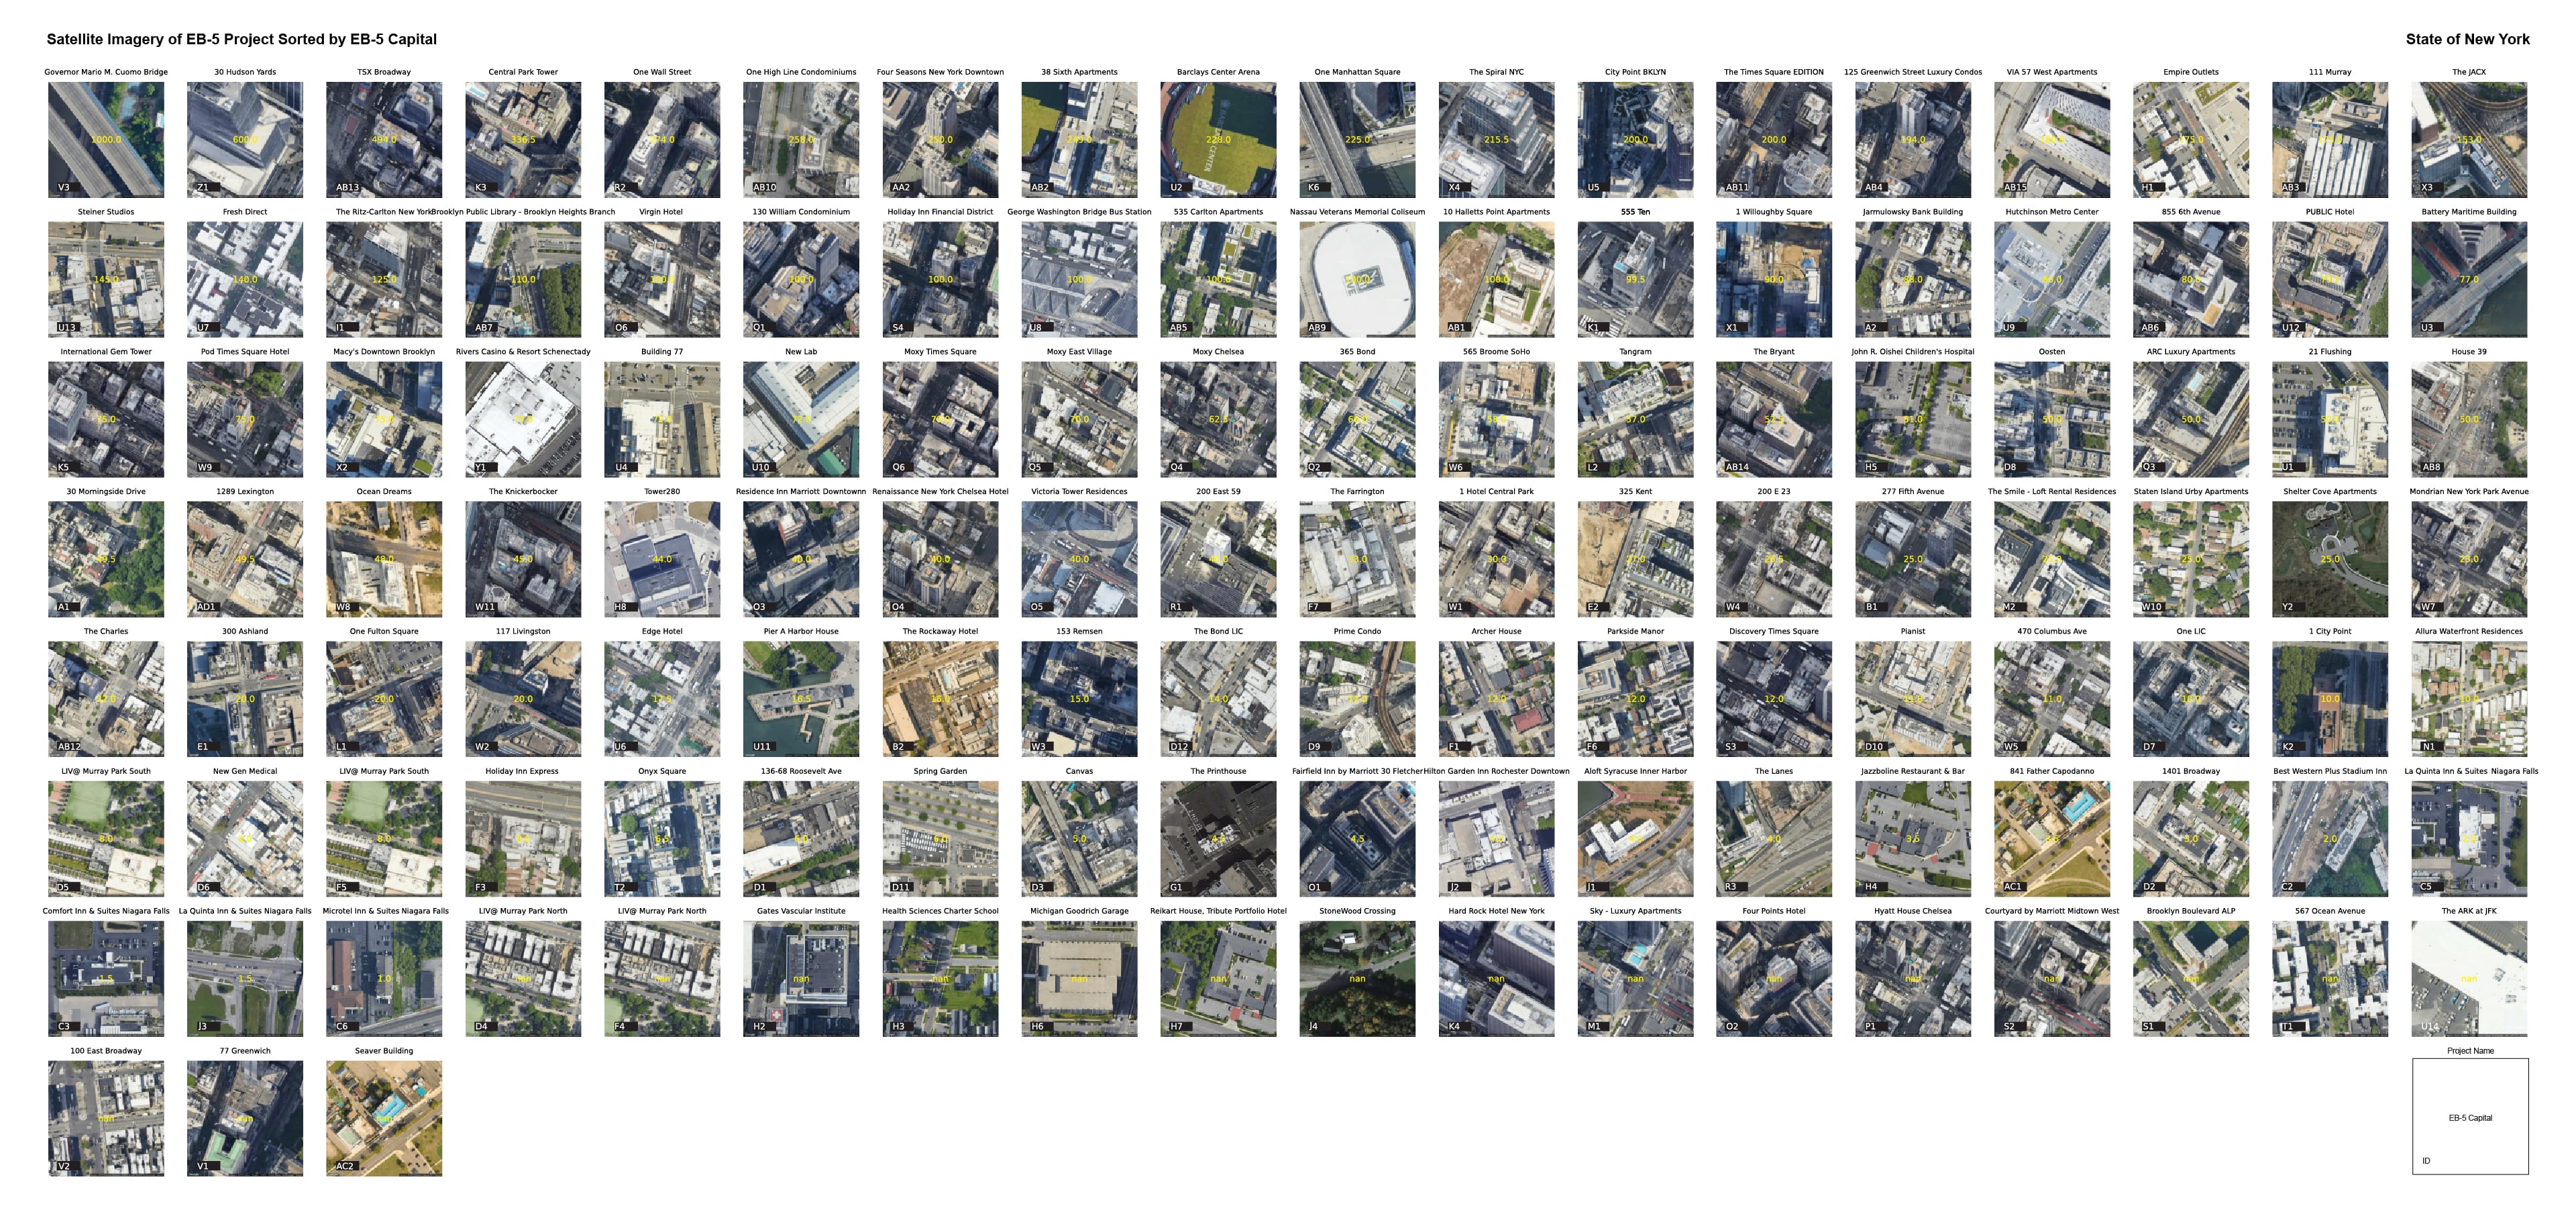
The plot shows the satellite imagery of the New York EB-5 project, sorted by EB-5 capital. The most expensive project that utilized EB-5 capital is Governor Mario M. Cuomo Bridge in Terrytown. Estimated one billion dollars were sought from foreign investors.[16] The second and third most expensive projects are 30 Hudson Yard (600 million) and TSX Broadway in Time Square (494 million) respectively. The bottom rows include projects without EB-5 capital confirmed.
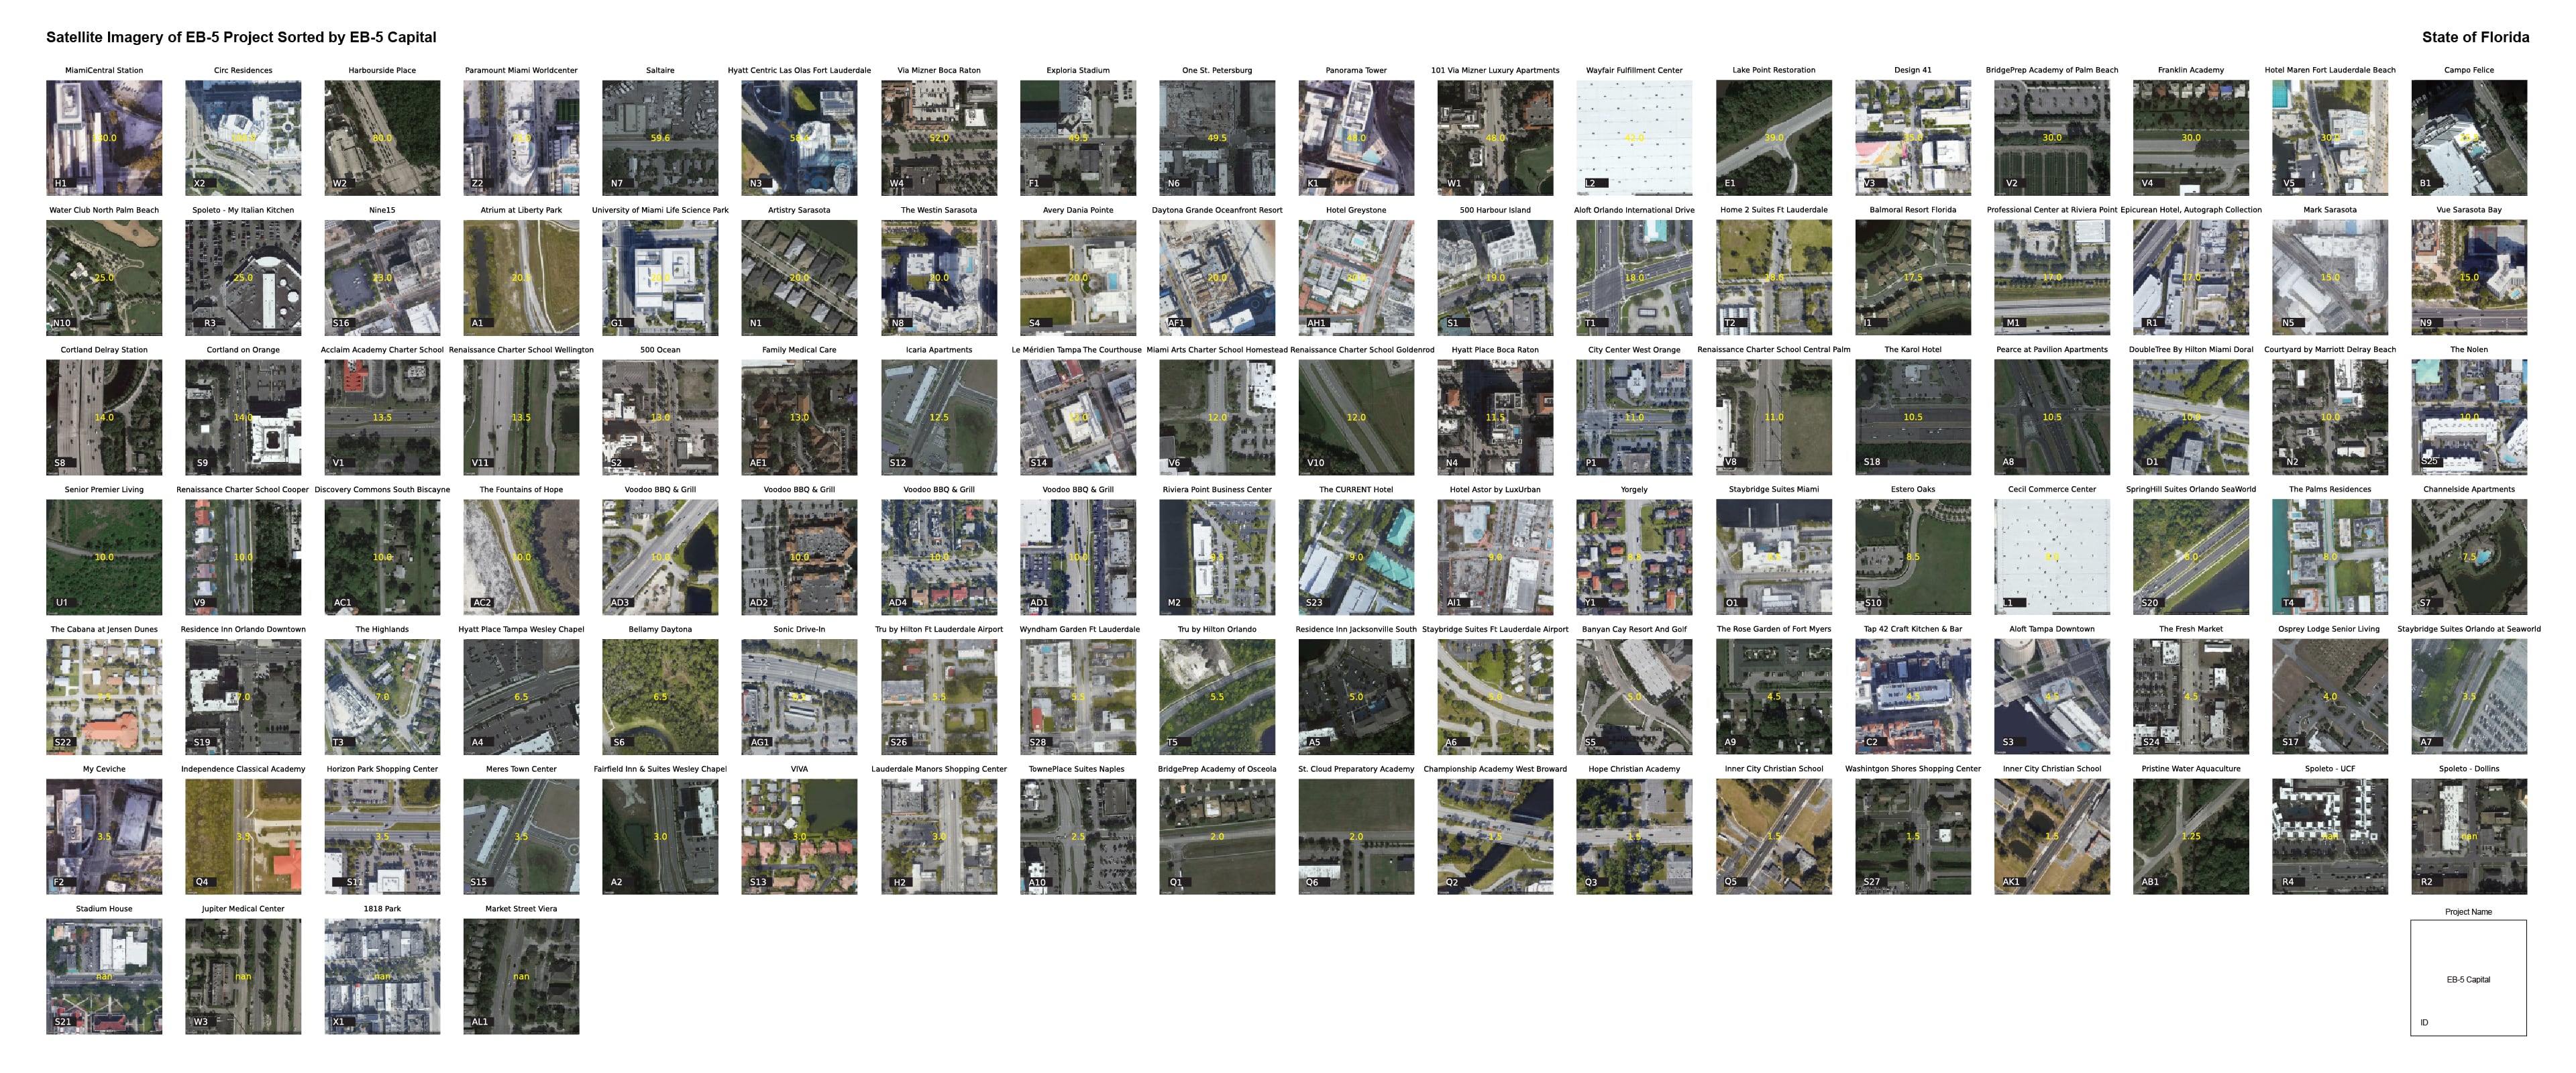
The plot shows the satellite imagery of the Florida EB-5 project, sorted by EB-5 capital. The most expensive project that utilized EB-5 capital is Miami Central Station by CanAm Enterprise for 130 million dollars. The second and third most expensive project is Circ Residences (100 million) and MICROLUXE® Residences (95 million) respectively. However, the most expensive proposed projects that failed or were postponed due to financing are CCCC Miami Towers (350 million) and SkyRise Miami (270 million) respectively. The bottom rows include projects without EB-5 capital confirmed.
Part 4: Project Documentation
For the final touch of the project, it is important to document the actual site of the project from the street view that is not able to capture in detail by available data and satellite imagery. Here are the selected project photographs for New York and Florida EB-5 projects.

The Times Square EDITION (left) and TSX Broadway (right) in Time Square were financed by U.S. Immigration Fund - NY.
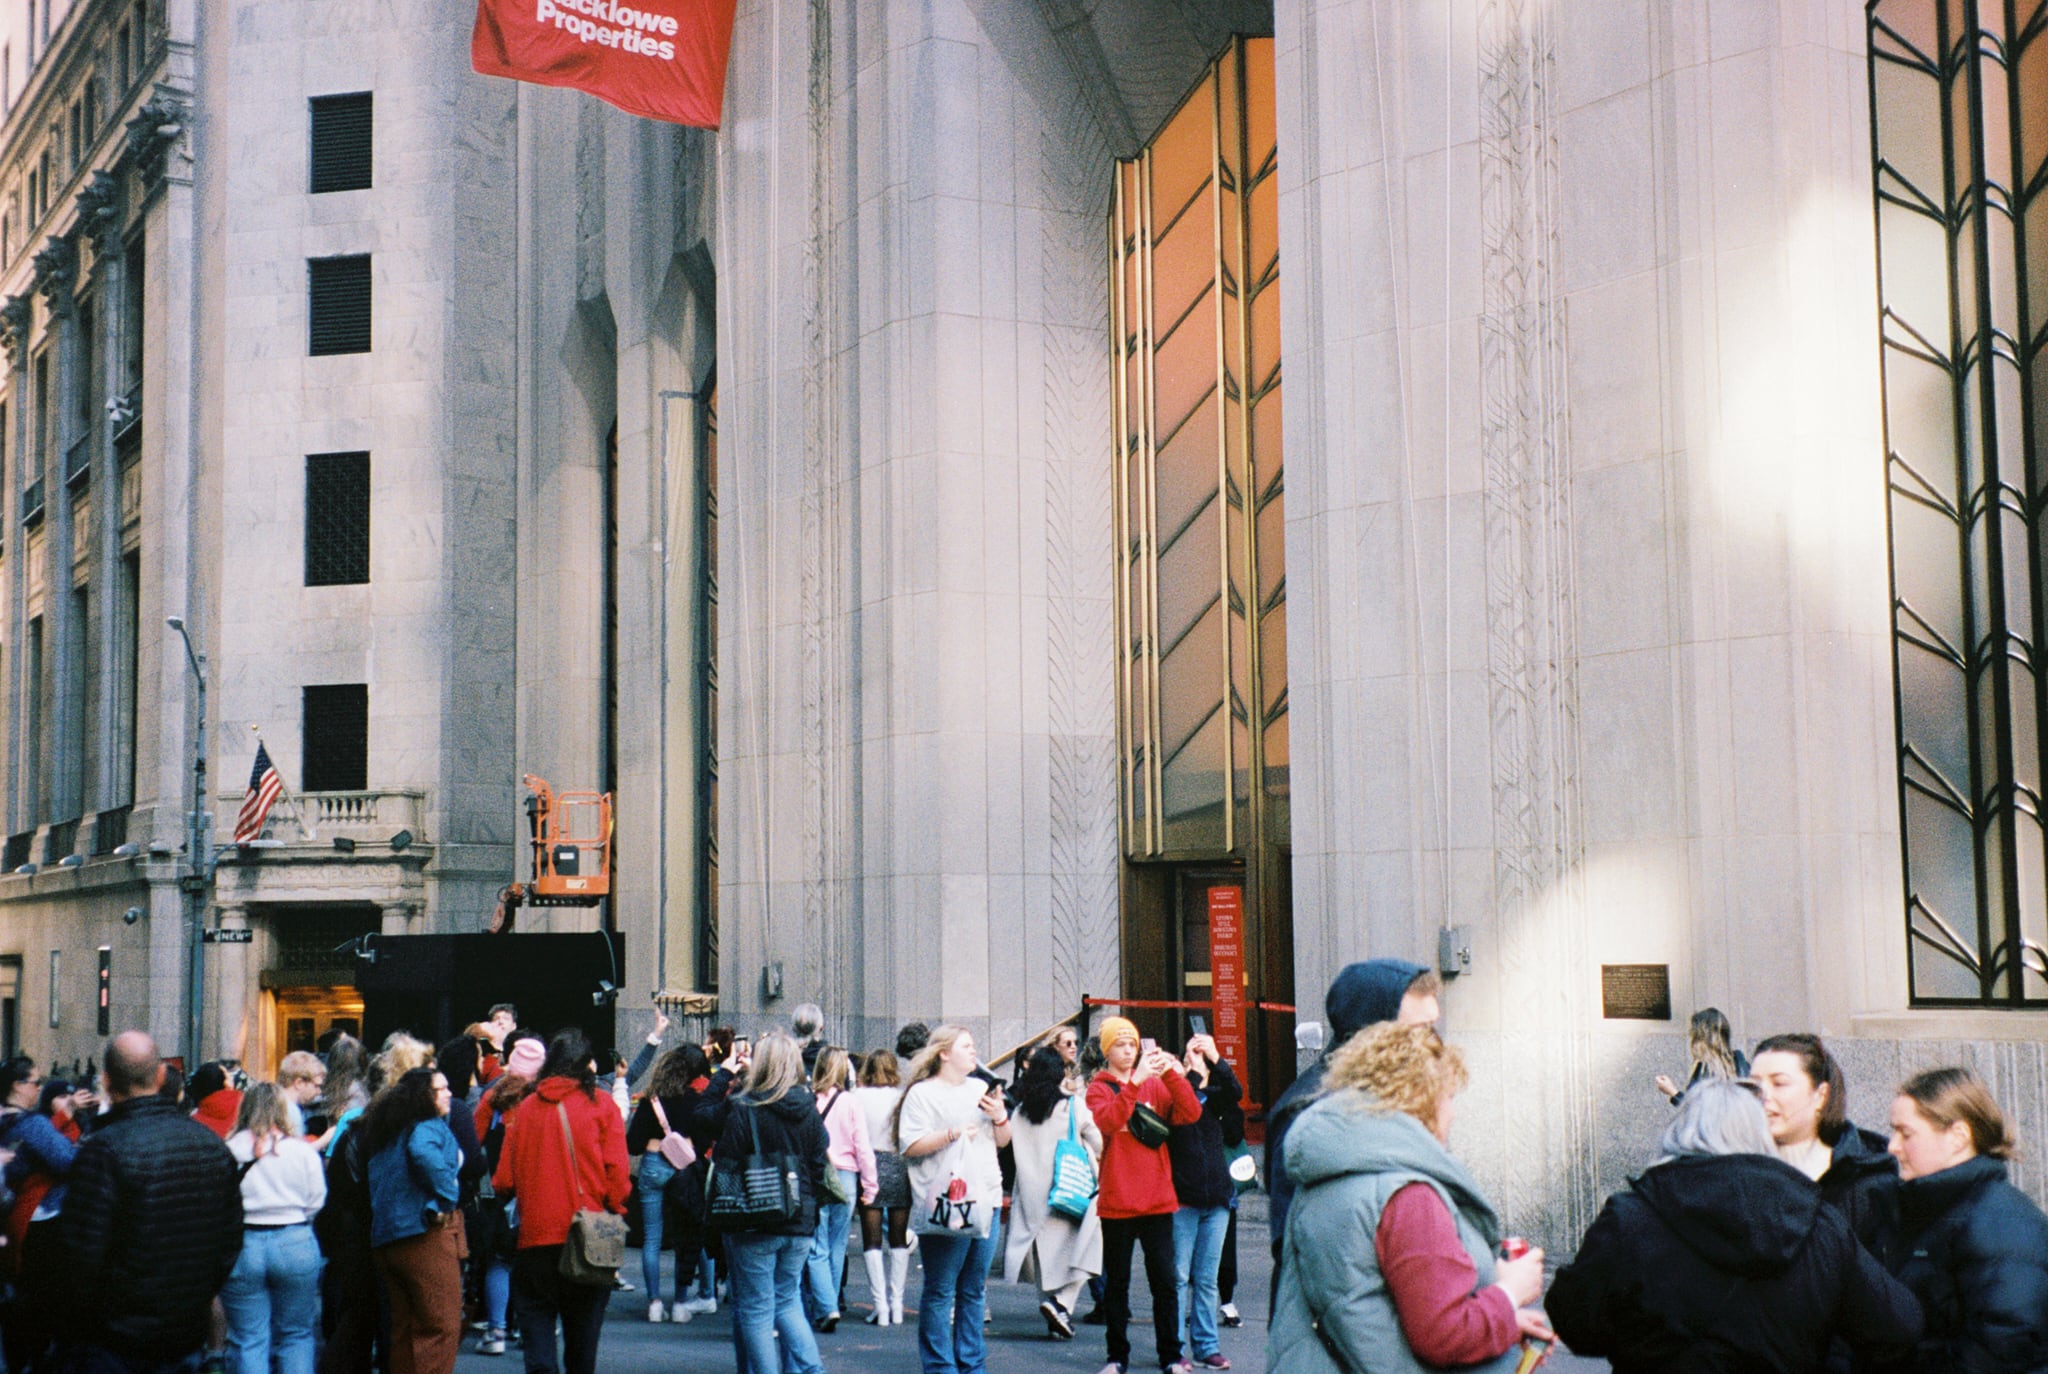
One Wall Street in the Financial District was financed by the LCP Group, Live in America - New York Regional Center, and developed by Macklowe Properties. One Wall Street is an example of many recent redevelopments of historical buildings in FiDi.
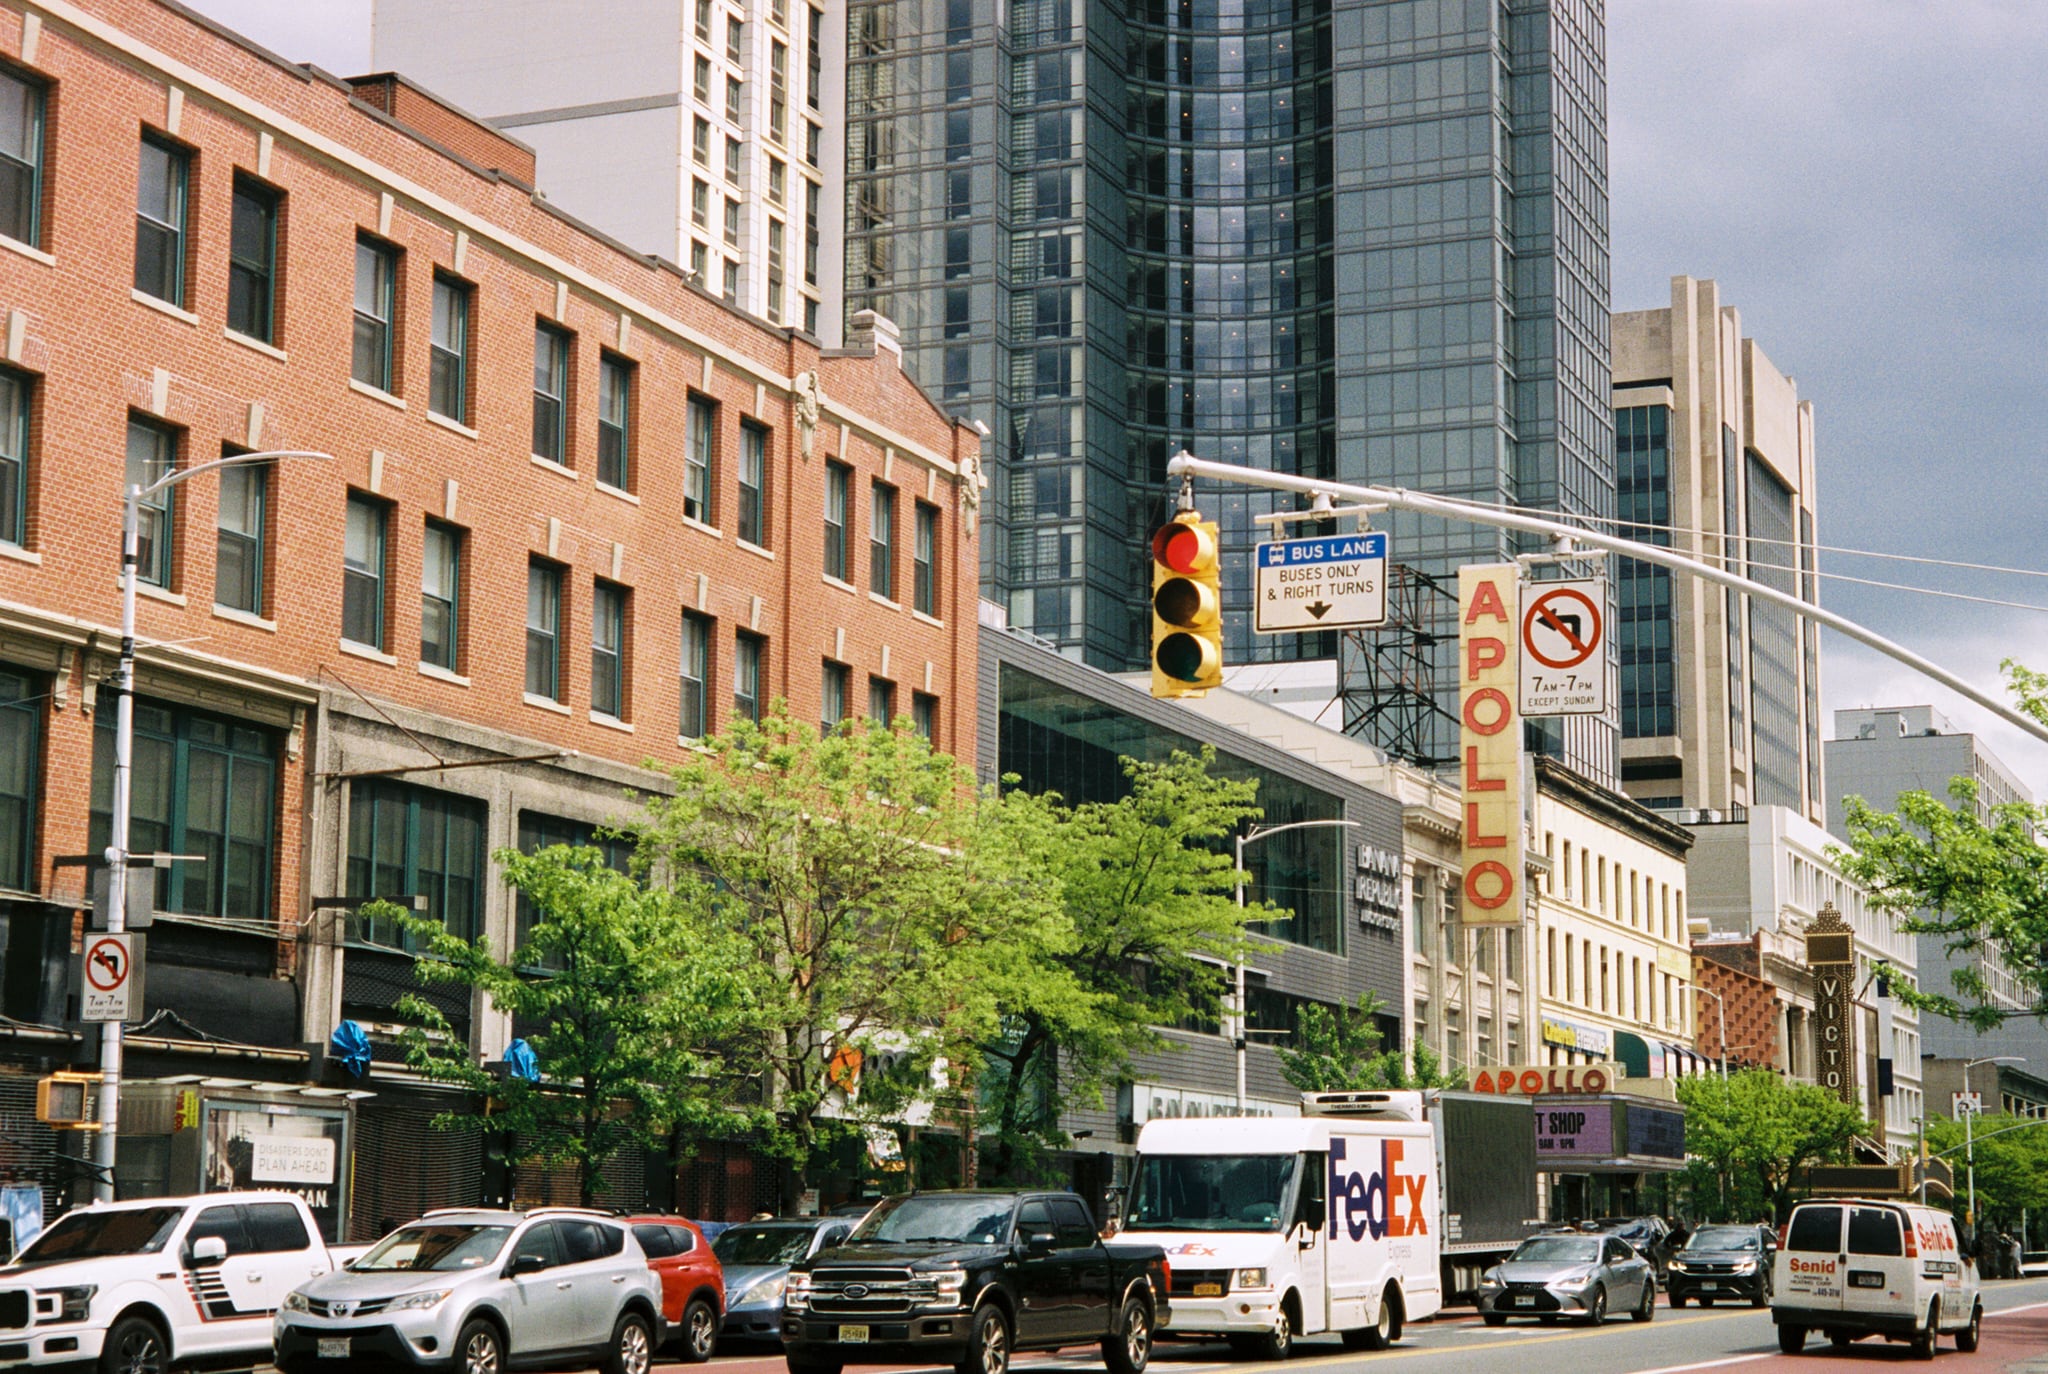
The Victoria Theater redevelopment project in Harlem was developed and financed by Lam Group and Lam NYC EB-5 Fund Regional Center.
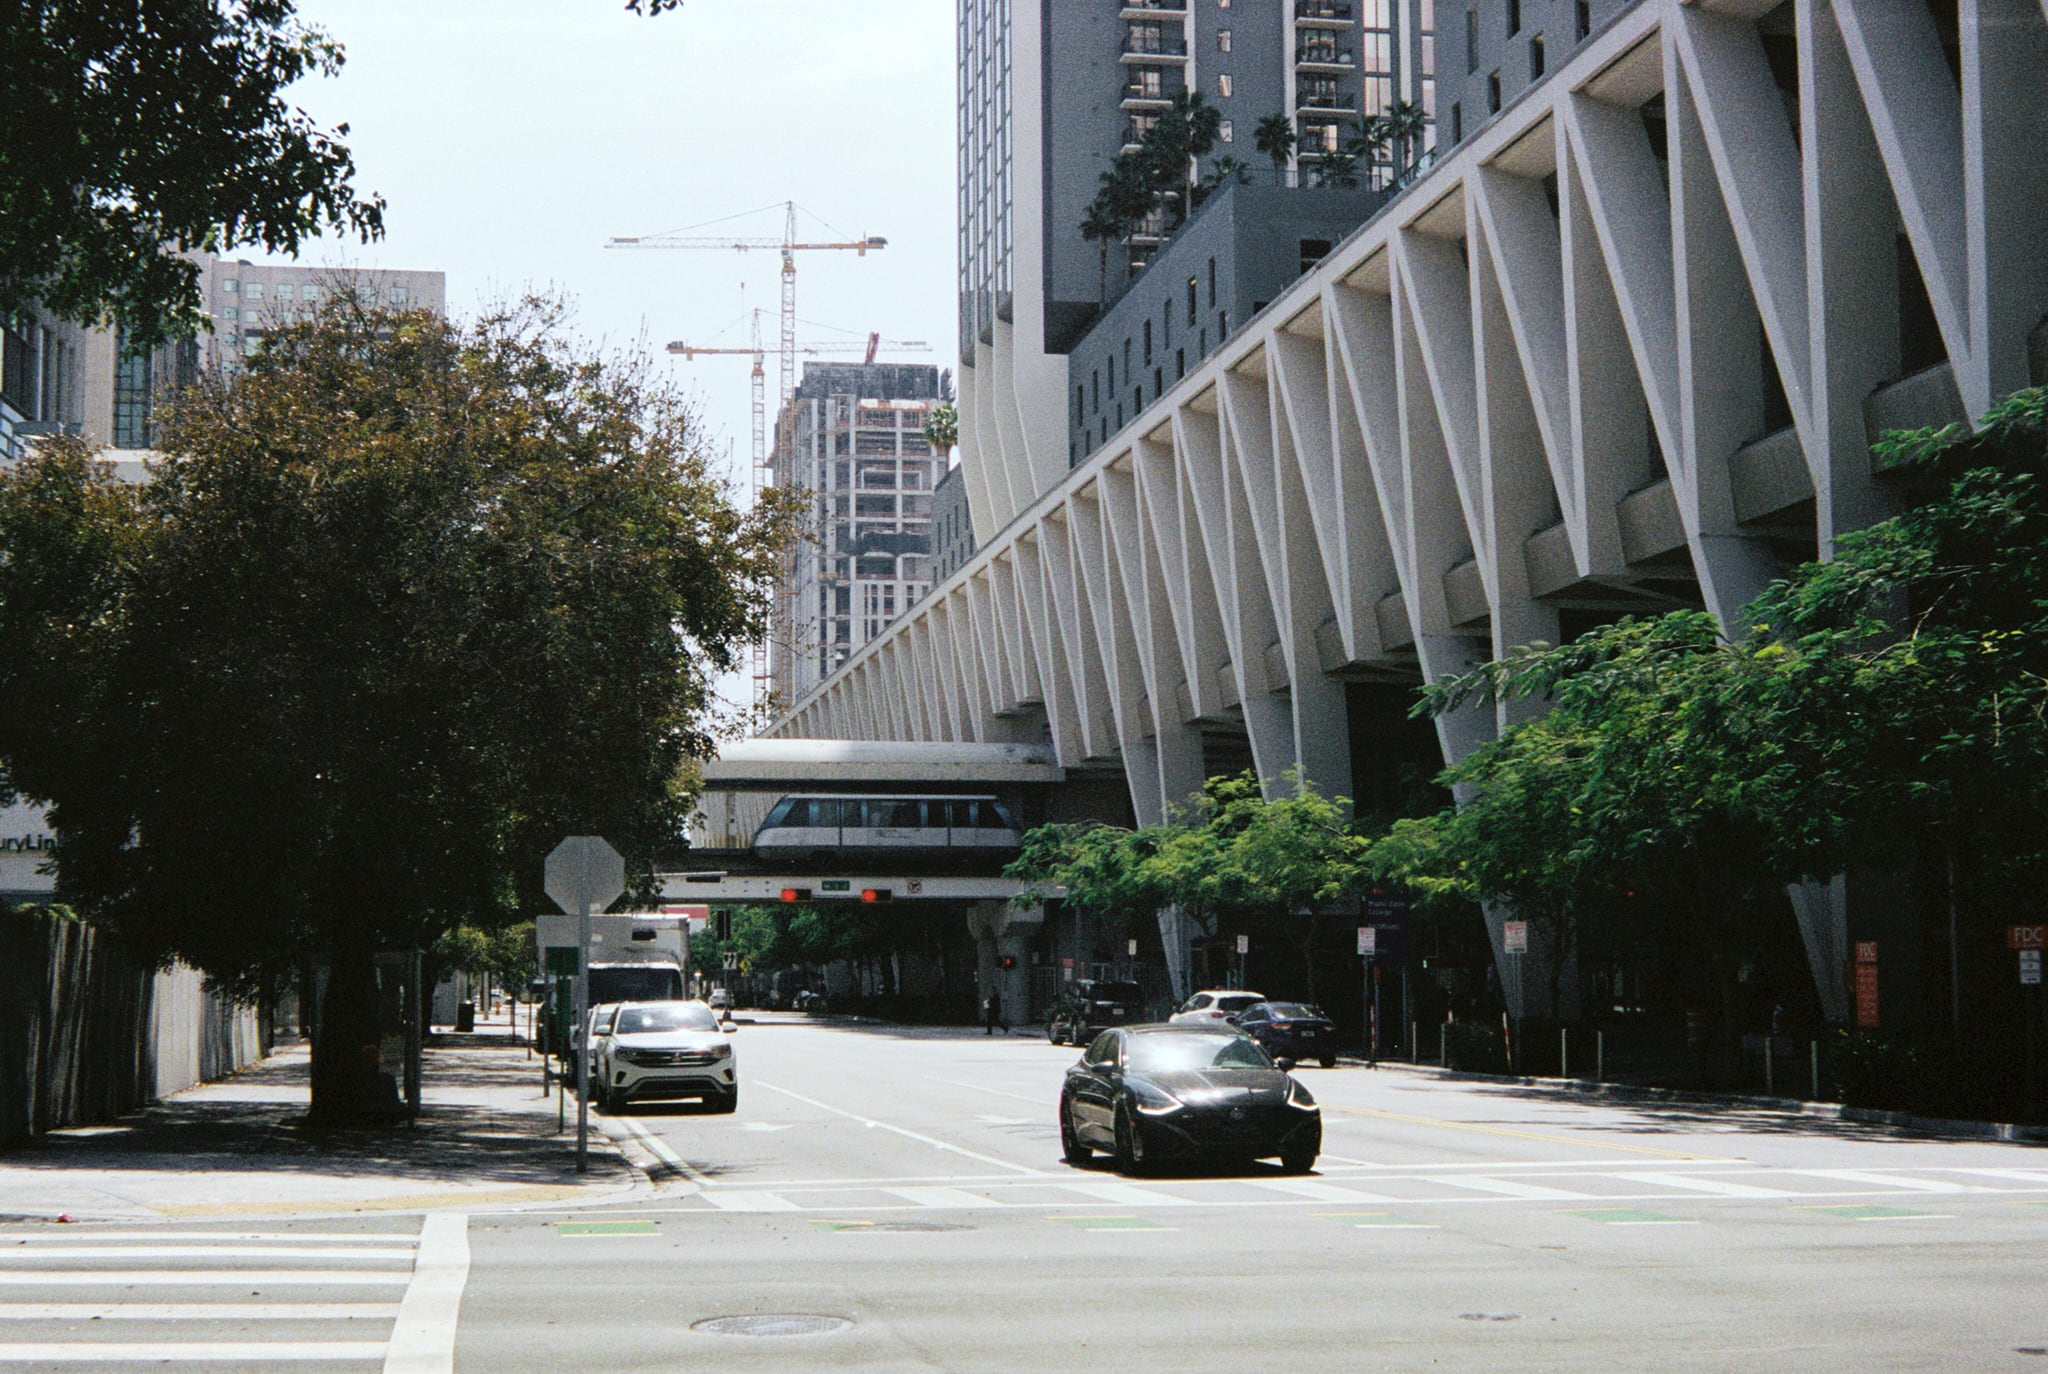
Miami Central Station was financed by CanAm Florida Regional Center, LLC and developed by All Aboard Florida. SOM was the architect.
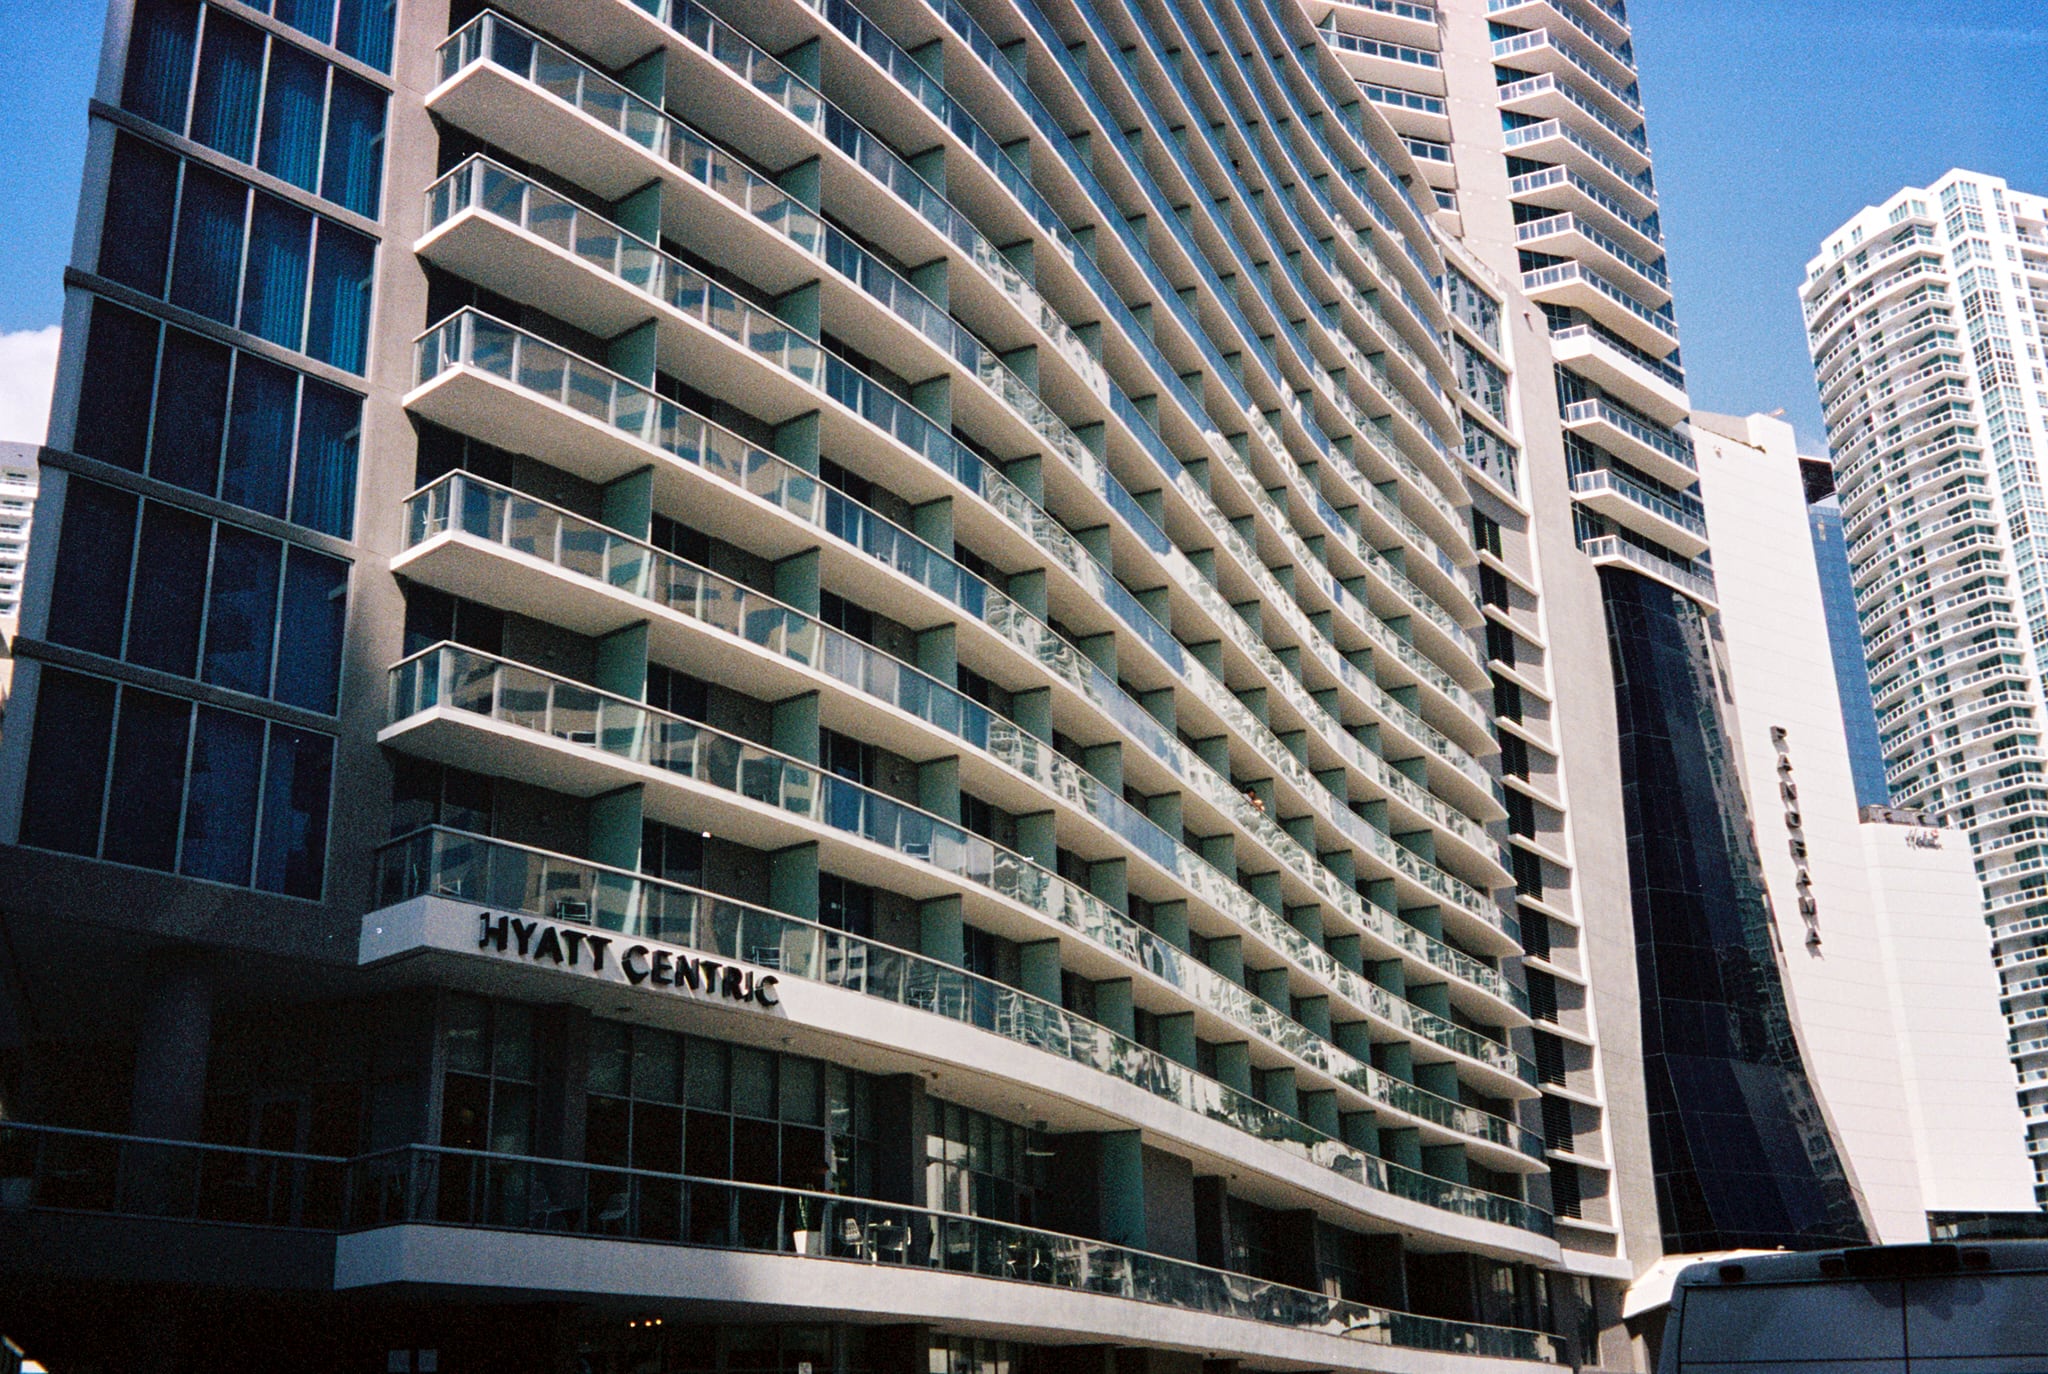
The City of Miami EB5 Regional Center helped finance Panorama Tower in Miami. Florida East Coast Realty was the developer.
SkyRise Miami was set to be the tallest building in Miami. The project never came to reality due to troubled financing. The image shows the empty construction site. Berkowitz Development Group was the developer, and Miami Metropolitan Regional Center helped arrange EB-5 capital.
Conclusion
It would be a stretch to say that this program is a solution to utilizing the country as a business to generate capital, or to mastermind it as an alternative workaround to relocate domestic needs and responsibilities. There are more powerful tools, like the US dollar, that can be leveraged for global and domestic affairs. My perspective on the program is that it was one of the outcomes of opportunism and circumstances during the decline of Federal power.
Many surprises emerged during the progress of my research, although not so surprisingly, East Asian investors, especially from mainland China, contributed the most to the program, even though visa issuance has been considerably curtailed due to the backlog and the limited country quota in recent years. Political concerns and financial freedom may be the main reasons for surging Chinese immigrant investors; however, I reserve my point of view until the hypothesis is proven.
Secondly, after years of the project launch, New York, for example, matched the overall real estate market. Despite the program’s policy and regulations on prioritizing rural and high-unemployment areas, local governments and private sectors could always circumvent the laws and restrictions and make the most in their favor. Examples include five-star hotels in Times Square and the Financial District in Manhattan, luxury condos in downtown Miami, and other projects that do not prioritize rural or high-unemployment areas. However, many good projects that later benefit local development, like Brooklyn Navy Yards and new charter schools in Florida, were fostered because of the EB-5 program.
Ultimately, the project hopes to serve as an example of America’s political philosophy, a reflection of the circumstantial post-American world, and a demonstration of economic geography under the policy’s engine. The project questions the global dynamics: the reliance on capital aid from affluent immigrants to mitigate domestic problems. Are we experiencing a new Orientalism?
Methodology
1. Data Collection
Due to the Security Act, there is no publicly available dataset for every invested project. Although investors and regional centers are required to submit reports and file the application to USCIS by law, which suggests USCIS has the most comprehensive data collection, it is unlikely USCIS would grant permission to such private information. I created and compiled the dataset myself.
First, I downloaded the list of Approved EB-5 Regional Centers and the list of Regional Center Terminations released by USCIS to find out every existing and exited regional center. Second, I narrowed the research to only New York and Florida. I searched each regional center's name on Google and used the third-party website "eb5projects.com" to check if any useful information was returned. Usually, an active and successful regional center would have a website including past EB-5 projects as a testimony to advertise their current project. The website "eb5projects.com" has been around for years as the demand for due diligence. I found both regional center and EB-5 project information through regional center websites and "eb5projects.com." Then, to find out the capital structure and developers of EB-5 projects, one of the major sources, regional center websites, and real estate news media like The Real Deal, YIMBY, and The Business Journal would have information available. High-profile, big projects tend to have more detailed information. Research papers "A Roadmap to the Use of EB-5 Capital" and "EB-5 Capital Project Database" by Professor Jeanne Calderon at NYU Stern School of Business have detailed information for selected EB-5 projects. Finally, I used Market Proof, CTBUH, and other real estate listing websites to find architectural firms for the projects. In general, New York City has more comprehensive data available.
2. Data Analysis
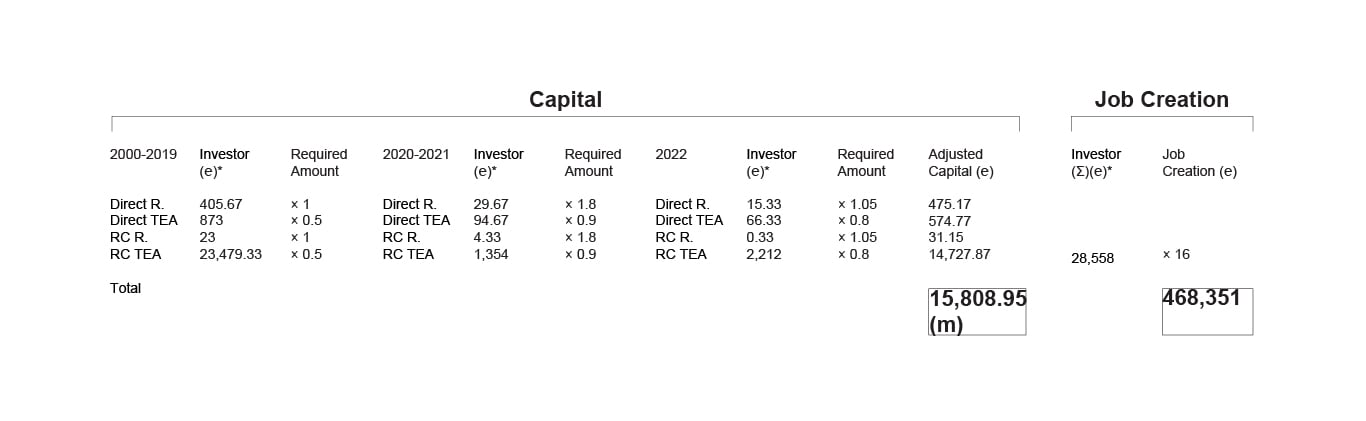
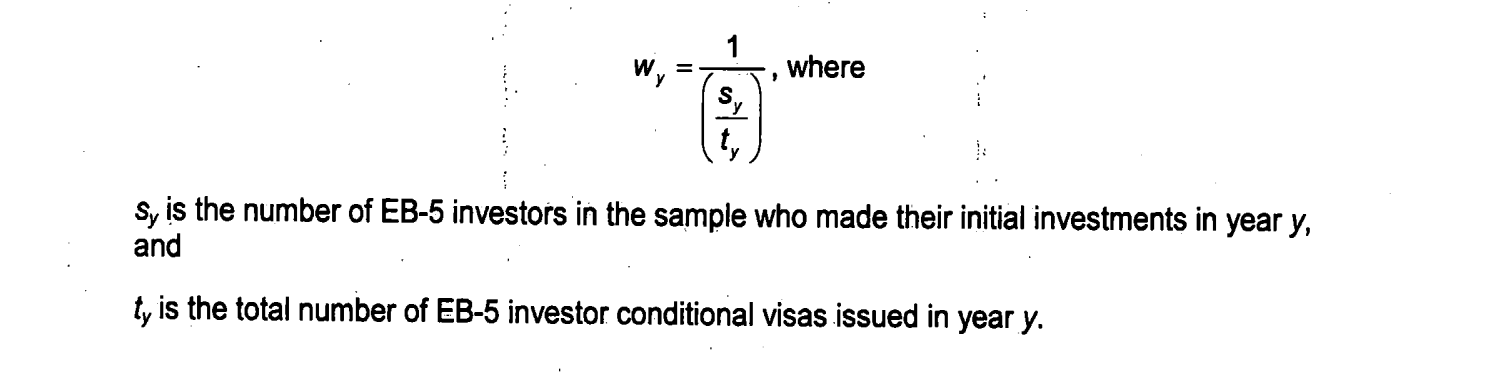
To calculate the invested EB-5 capital, based on the versions of the required minimum investment amount, there are three periods of time: fiscal year 1992 to 2018, 2019 to 2021, and after 2022. First, I used visa issuance data from “Department of State, Preference Immigrant Visas Issued, Table VI'' to estimate how many investors there were for each year. Based on a Brookings Institution research study that showed that one investor brought two additional immediate family members,[17] I weighed the visa issuance by ⅓ to reflect the approximate number of investors. The following image shows the formula used in a USCIS report.[18]
Second, I multiplied the number of investors each year based on the required minimum investment amount in the visa categories (EB-5 direct investment, EB-5 targeted employment, EB-5 regional pilot, EB-5 regional TEA), and then summarized the total. After this process, I obtained the estimated EB-5 capital and created a plot.
For calculating job creation, similar to EB-5 capital, I used the same estimated number of investors each year. Then, I summarized the total number of investors. As at least 10 jobs must be created by each investor, the minimum job creation would be the number of investors multiplied by 10. Since average job creation varied in different states, I chose New York as the weight for estimation, which is 16 jobs per investor.
To map project IDs, the first step was to create an ID for each EB-5 project. I sorted regional center names in descending order and created a new regional center ID from A to Z. Then, I sorted projects for each regional center and indexed them from 1 to 10, and so on. Finally, I combined the new regional center IDs and project indexes with project IDs. I displayed the project IDs on the map according to their coordinates.
To calculate project clusters for mapping, I converted the project's address coordinates into XY points in ArcGIS. Then, I used clustering in an aggregation function to make dynamic point clusters. To calculate EB-5 capital clusters, similar to project clusters, I multiplied the aggregation number by the average project's EB-5 capital. Then, I obtained the capital clusters distributed by location and summarized the capital amount.
For network analysis, I used an R script to convert the focused columns into nodes. Then, I calculated the degree of the vertex. Finally, I plotted the graph as a tree layout.
3. Handle Missing Value
While most regional centers list their project's EB-5 capital as a testament on their website, not every regional center publishes their project's capital stack due to security reasons. This leads to some missing EB-5 capital values in my dataset. To address this, I employed the k-nearest neighbors (KNN) algorithm to estimate the missing values. I based these estimates on the EB-5 capital of the five geographically closest projects within a 1-mile distance limitation.
If the KNN-estimated EB-5 capital value exceeded 90% of the total project cost, which is unlikely to occur for bridge financing projects, the method would switch to multiplying the project cost by the average of the closest project's (EB-5)/(total cost) ratio.
It's important to note that this estimation approach may carry inherent biases and subjectivity. In the maps titled "EB5 Project and Capital Distribution, NY" and "EB5 Project and Capital Distribution, FL," I minimized estimation errors by using the average EB-5 capital per subdivision and color classification. This approach provides a more general sense of high-to-low values compared to detailed numerical figures.
4. Limitation
The lack of comprehensive public data and discrepancies between governmental documentation and scholarly research may have resulted in some errors in this project. For instance, my research may have underestimated the number of visa issuances, first due to the unavailability of data before 2000 on the Department of State's website, and second, because it did not include immigrant investors who filed I-485 adjustment of status in the US.
I have put in significant effort to verify and ensure the accuracy of the information. However, this standalone project may have overlooked some key details that I may not have noticed. I welcome any interested researchers or professionals to suggest improvements.
Acknowledgments
The project was advised by Adjunct Assistant Professor Dan Taeyoung and was developed in colloquium under Professor Laura Kurgan, Adjunct Assistant Professor Snowaria Zhang, and Adjunct Assistant Professor Seth Thomson at Columbia University. However, the text, the data accuracy, and any further issue of this project is my sole responsibility.
Data Source
References
Erb, K. P. (n.d.). The EB-5 Visa: United States Citizenship For Sale? Retrieved May 3, 2023, from Forbes website: https://www.forbes.com/sites/kellyphillipserb/2017/05/10/the-eb-5-visa-united-states-citizenship-for-sale/?sh=5ce000d52cb9 ↩︎
Bush, G. (1990, November 29). Statement on Signing the Immigration Act of 1990 | The American Presidency Project. Retrieved from www.presidency.ucsb.edu website: https://www.presidency.ucsb.edu/documents/statement-signing-the-immigration-act-1990 ↩︎
Walsh, C. E. (1993). What caused the 1990-1991 recession? Economic Review - Federal Reserve Bank of San Francisco, (2), 33. ↩︎
Gardner, J. M. (1994). The 1990-91 recession: how bad was the labor market? Monthly Labor Review, 117(6), 3–11. http://www.jstor.org/stable/41844298 ↩︎
Herbers, J., & Times, S. T. the N. Y. (1982, November 28). REAGAN TO ASK CUT IN RURAL AREA AID. The New York Times. Retrieved from https://www.nytimes.com/1982/11/28/us/reagan-to-ask-cut-in-rural-area-aid.html ↩︎
S.2298 - 97th Congress (1981-1982): Enterprise Zone Tax Act of 1982. (1982, September 28). https://www.congress.gov/bill/97th-congress/senate-bill/2298 ↩︎
S.358 - 101st Congress (1989-1990): Immigration Act of 1990. (1990, November 29). https://www.congress.gov/bill/101st-congress/senate-bill/358 ↩︎
EB-5 Immigrant Investor Program | USCIS. (2020, June 10). Retrieved from www.uscis.gov website: https://www.uscis.gov/working-in-the-united-states/permanent-workers/eb-5-immigrant-investor-program ↩︎
EB-5 Immigrant Investor Pilot Program 2 General EB-5 Program Overview Background. (n.d.). Retrieved from https://www.uscis.gov/sites/default/files/document/presentations/EB-5 Investor Pilot Program.pdf ↩︎
Singer, A., & Galdes, C. (2014). Project on State and Metropolitan Innovation Improving the EB-5 Investor Visa Program: International Financing for U.S. Regional Economic Development (p. 2). Retrieved from https://www.brookings.edu/wp-content/uploads/2016/06/EB5_Report.pdf ↩︎
Calderon, J., Lecturer, G., & Friedland, G. (2015). “A Roadmap to the Use of EB-5 Capital: An Alternative Financing Tool for Commercial Real Estate Projects” (p. 20). Retrieved from https://www.stern.nyu.edu/sites/default/files/assets/documents/EB5 paper final 5.24.2015.pdf ↩︎
Li, L. (2021, August 20). Analysis: Impact of the Lapse of the EB-5 Regional Center Program on Investors, Investments & Jobs. Retrieved May 3, 2023, from Invest In the USA website: https://iiusa.org/blog/iiusa-data-analysis-impact-of-the-lapse-of-the-eb-5-regional-center-program-on-investors-investments-and-job-creation/ ↩︎
Office of the Federal Register, National Archives and Records Administration. (2019, July 23). 84 FR 35750 - EB-5 Immigrant Investor Program Modernization. [Government]. Office of the Federal Register, National Archives and Records Administration. https://www.govinfo.gov/app/details/FR-2019-07-24/2019-15000 ↩︎
Text - H.R.2901 - 117th Congress (2021-2022): EB–5 Reform and Integrity Act of 2021. (2021, October 19). https://www.congress.gov/bill/117th-congress/house-bill/2901/text ↩︎
Report to Congressional Committees IMMIGRANT INVESTORS Small Number of Participants Attributed to Pending Regulations and Other Factors. (2005). Retrieved from https://www.gao.gov/assets/gao-05-256.pdf ↩︎
Calderon, J., Lecturer, G., & Friedland, G. (2015). “A Roadmap to the Use of EB-5 Capital: An Alternative Financing Tool for Commercial Real Estate Projects” (p. 33). Retrieved from https://www.stern.nyu.edu/sites/default/files/assets/documents/EB5 paper final 5.24.2015.pdf ↩︎
Galdes, A. S. and C. (2014, February 5). Improving the EB-5 Investor Visa Program: International Financing for U.S. Regional Economic Development. Retrieved May 6, 2023, from Brookings website: https://www.brookings.edu/research/improving-the-eb-5-investor-visa-program-international-financing-for-u-s-regional-economic-development/ ↩︎
ICF International. (2010). Study of the United States Immigrant Investor Pilot Program (EB-5). In USCIS (p. 10). Retrieved from https://www.uscis.gov/sites/default/files/document/reports/EB5-Report-2010.pdf ↩︎